This site uses cookies to improve your experience. To help us insure we adhere to various privacy regulations, please select your country/region of residence. If you do not select a country, we will assume you are from the United States. Select your Cookie Settings or view our Privacy Policy and Terms of Use.
Cookie Settings
Cookies and similar technologies are used on this website for proper function of the website, for tracking performance analytics and for marketing purposes. We and some of our third-party providers may use cookie data for various purposes. Please review the cookie settings below and choose your preference.
Used for the proper function of the website
Used for monitoring website traffic and interactions
Cookie Settings
Cookies and similar technologies are used on this website for proper function of the website, for tracking performance analytics and for marketing purposes. We and some of our third-party providers may use cookie data for various purposes. Please review the cookie settings below and choose your preference.
Strictly Necessary: Used for the proper function of the website
Performance/Analytics: Used for monitoring website traffic and interactions
A 50-something man presented in shock with severe chest pain. His prehospital ECG was diagnostic of inferior posterior OMI. The patient was in clinical shock with a lactate of 8. BP was 108 systolic (if a cuff pressure can be trusted) but appeared to be maintaining BP only by very high systemic vascular resistance. He appeared gray in color, with cool skin.
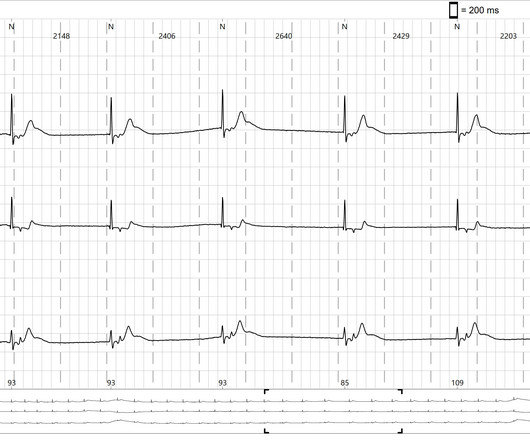
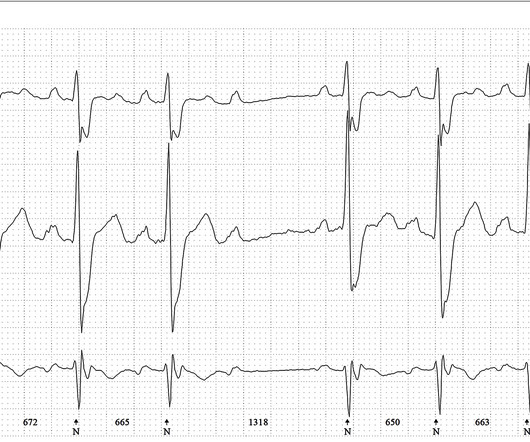
I was sent the Holter monitor tracing in Figure-1 — but without the benefit of any clinical information. QUESTIONS: A total of 9 QRS complexes are seen in the 2 simultaneously-recorded monitoring leads. How would YOU interpret the rhythm in Figure-1 ? How many P waves do you see? Why do the QRS complexes of beats #4 and 5 in the bottom lead look different than the other 7 beats?
This ECG comes from a 75 yo man who had 2 syncopes in the past few weeks. The 12-lead-EKG at the family doctor showed an inconspicuous finding. Here you can see a section of the patients Holter ECG. There is a very slow junctional escape rhythm. How can this be recognized?
The World Health Organisation (WHO) formally proclaimed COVID-19, the illness spread by a zoonotic SARS-CoV-2, as a pandemic in March 2020, after it had started to spread in late 2019. Even though the pandemic is on the wane, new studies and evidence about it continue to emerge. And, addressing myocardial infarction, recent studies have shown that 1-4% of Athletes untimely die due to myocarditis caused by COVID-19.
Speaker: Simran Kaur, Co-founder & CEO at Tattva Health Inc.
AI is transforming clinical trials—accelerating drug discovery, optimizing patient recruitment, and improving data analysis. But its impact goes far beyond research. As AI-driven innovation reshapes the clinical trial process, it’s also influencing broader healthcare trends, from personalized medicine to patient outcomes. Join this new webinar featuring Simran Kaur for an insightful discussion on what all of this means for the future of healthcare!
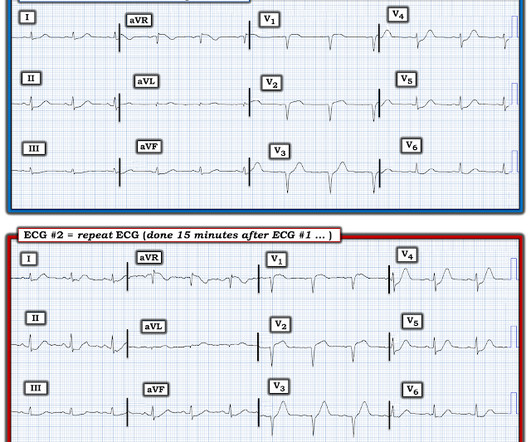
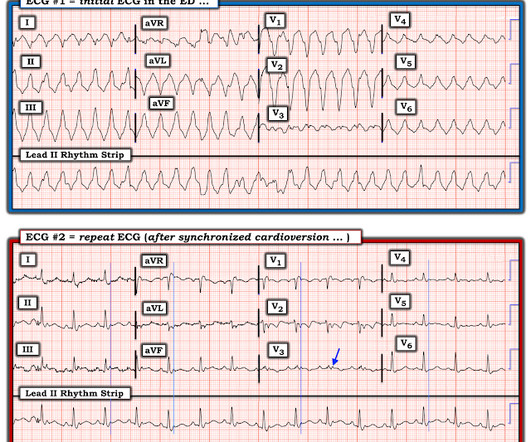
I received the following text message with these 3 EKGs (providers text me ECGs all day every day; most are false positives; many are subtle true positives): "Hi Steve, here are 3 EKGs for you (my colleague's case). A 67 yo f developed chest pain this morning." EKG #1 Followed 15 minutes by this #2 EKG: Then the patient received aspirin and Dilaudid (hydromorphone, same effect as morphine) and the pain went away and there was this 3rd ECG: Smith comment: hydromorphone will make any pain go away
This secondary analysis of the HOST-EXAM randomized clinical trial evaluates clopidogrel vs aspirin for long-term maintenance after percutaneous coronary intervention in patients with diabetes.
This ECG is from an 80-year-old lady who has collapsed or had sycopal episodes several times. The ECG comes from a Holter monitor. She has arterial hypertension and coronary artery disease. The ECG shows a second-degree, Mobitz Type II AV block. In both types of AVB, the PP intervals are usually the same.
This ECG is from an 80-year-old lady who has collapsed or had sycopal episodes several times. The ECG comes from a Holter monitor. She has arterial hypertension and coronary artery disease. The ECG shows a second-degree, Mobitz Type II AV block. In both types of AVB, the PP intervals are usually the same.
Written by Pendell Meyers A woman in her 30s with minimal past medical history presented simply stating she was "feeling unwell." Her symptoms started suddenly about 48 hours ago, but had continued to worsen, including epigastric discomfort, nausea, cough, and dyspnea and lightheadedness on exertion. She denied chest pain and denied feeling any palpitations, even during her triage ECG: What do you think?
Why is this left atrial atypical atrial flutter ( ECG 1 )? Atrial fibrillation can be excluded because nice flutter waves (all look the same) can be clearly identified. With typical right atrial flutter, the reentry circle runs counterclockwise and we see typical saw tooth patterns in the inferior leads (negative flutter waves). The flutter waves are positive in V1 ( ECG 2 ).
This prespecified analysis of the DELIVER trial evaluates the effect of dapagliflozin on total (ie, first and recurrent) heart failure (HF) events and cardiovascular death among patients with HF with mildly reduced or preserved ejection fraction.
We organize all of the trending information in your field so you don't have to. Join thousands of users and stay up to date on the latest articles your peers are reading.
You know about us, now we want to get to know you!
Let's personalize your content
Let's get even more personalized
We recognize your account from another site in our network, please click 'Send Email' below to continue with verifying your account and setting a password.


Let's personalize your content