This site uses cookies to improve your experience. To help us insure we adhere to various privacy regulations, please select your country/region of residence. If you do not select a country, we will assume you are from the United States. Select your Cookie Settings or view our Privacy Policy and Terms of Use.
Cookie Settings
Cookies and similar technologies are used on this website for proper function of the website, for tracking performance analytics and for marketing purposes. We and some of our third-party providers may use cookie data for various purposes. Please review the cookie settings below and choose your preference.
Used for the proper function of the website
Used for monitoring website traffic and interactions
Cookie Settings
Cookies and similar technologies are used on this website for proper function of the website, for tracking performance analytics and for marketing purposes. We and some of our third-party providers may use cookie data for various purposes. Please review the cookie settings below and choose your preference.
Strictly Necessary: Used for the proper function of the website
Performance/Analytics: Used for monitoring website traffic and interactions
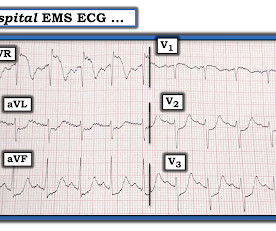
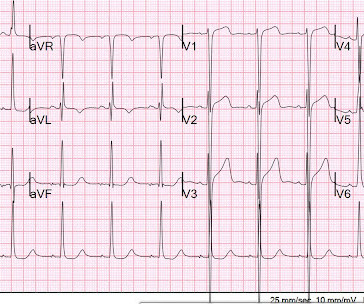
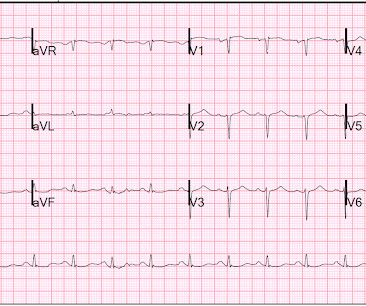
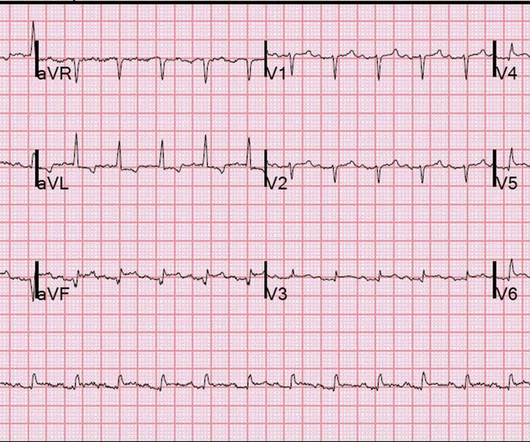
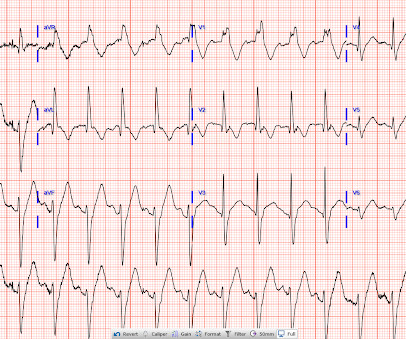
Here is the EMS ECG: Obviously massive diffuse subendocardial ischemia, with profound STD and STE in aVR Of course this pattern is most often seen from etoliogies other than ACS. The ECG only tells you there is ischemia, not the etiology of it. What do you think the echocardiogram shows? NTG drip started. Pain better still.
Important point: when there is diffuse subendocardial ischemia but no OMI, a wall motion abnormality will not necessarily be present. See this post: What do you think the echocardiogram shows in this case? They agreed ischemia was likely in the setting of demand given DKA and infection. 40 mg of furosemide was given.
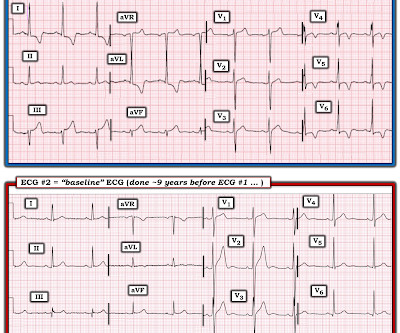
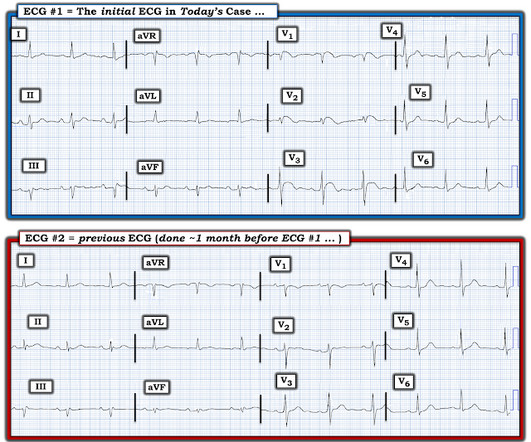
My written interpretation on a tracing such as this one would read, "Marked LVH and 'strain' and/or ischemia — with need for clinical correlation." BOTTOM LINE: ECG changes of LV "strain" and/or ischemia that we see on today's initial ECG — were not present 9 years earlier. Cardiac cath showed normal coronary arteries.
A transthoracic echocardiogram showed an LV EF of less than 15%, critically severe aortic stenosis , severe LVH , and a small LV cavity. DISCUSSION: The 12-lead EKG EMS initially obtained for this patient showed severe ischemia, with profound "infero-lateral" ST depression and reciprocal ST elevation in lead aVR.
This may result in ischemia (lack of oxygen to the heart muscle), causing parts of the heart to weaken and enlarge. Echocardiogram An echocardiogram uses sound waves to produce a detailed image of the heart, allowing doctors to see the size of the heart chambers and how well the heart is pumping blood.
It should be kept in mind that on occasions, beta-one agonist can result in increased ventricular ectopy e.g., in severe myocardial ischemia (by increasing myocardial demand), or sometimes with congenital long-QT syndrome. Smith, this can be accomplished by either using beta-one agonists or temporary transvenous pacing. J Am Coll Cardiol.
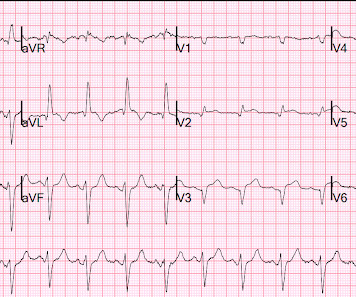
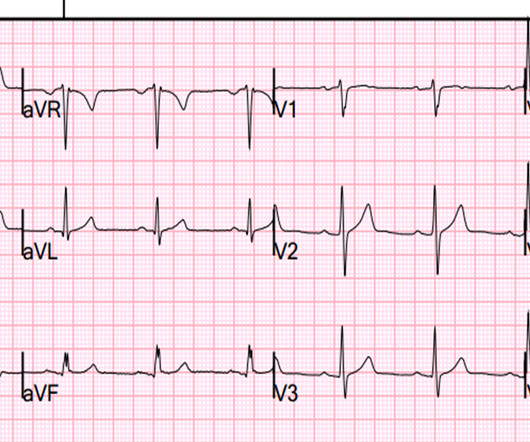
There is profound LVH with anterolateral ST elevation and reciprocal ST depression in II, III, aVF, and ST depression in V5 and V6 that could all be secondary to LVH or could represent ischemia superimposed on the repolarization abnormalities of LVH: note that wherever there is ST depression, it is associated with a very high voltage R-wave.
There is akinesis of the distal septum, anterior, apex, and distal inferior wall consistent with LAD territory ischemia or infarction. Echocardiography: Normal left ventricular size with mild to moderately reduced LV systolic function; estimated LVEF is 44 %. How large is the infarct? Probably significant infarction.
There is ST elevation in V2 and V3 There are inverted T-waves in V2 and V3 There are prominent U-waves in V2 and V3 Many responders were worried about ischemia or hypertrophic cardiomyopathy. This short QT at least makes ischemia all but impossible. This is a classic pattern and the QT is so short as to make ischemia very unlikely.
In any case, the ECG is diagnostic of severe ischemia and probably OMI. So this could be myocarditis but in my opinion needs an angiogram before making that diagnosis. == Dr. Nossen Comment/Interpretation: Evaluation of ischemia on an ECG can be very challenging. Concordant STE of 1 mm in just one lead or 2a.
Again, it is common to have an ECG that shows apparent subendocardial ischemia after resuscitation from cardiac arrest, after defibrillation, and after cardioversion. and repeat the ECG, to see if the apparent ischemia persists. A third ECG was done about 25 minutes after the first: This shows resolution of all apparent ischemia.
EKG, cardiac enzymes, and Initial echocardiogram(TTE) was unremarkable. Stress echocardiogram ruled out myocardial ischemia. However, symptoms resolved spontaneously, cardiac workup paused and he was monitored conservatively with serial Echocardiogram(TTE) until onset of dyspnea 3 years later.
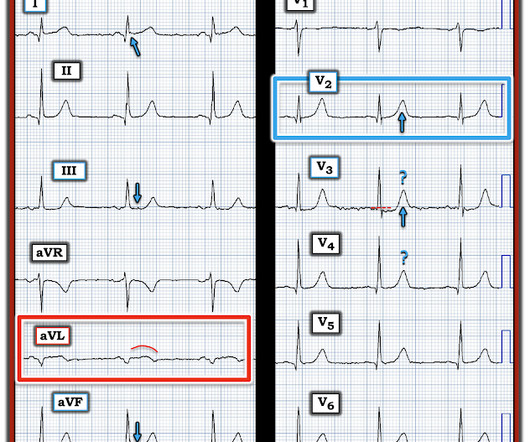
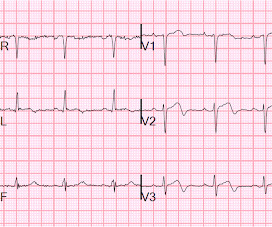
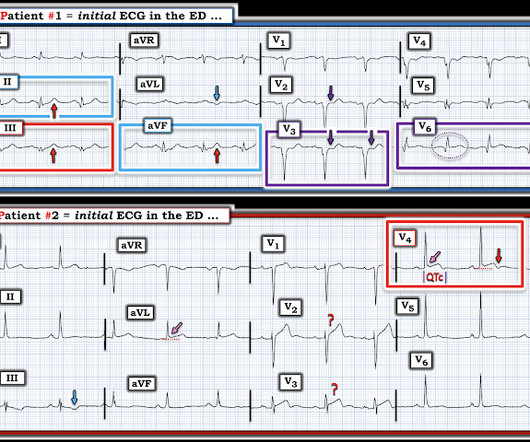
STE limited to aVR is due to diffuse subendocardial ischemia, but what of STE in both aVR and V1? The additional ST Elevation in V1 is not usually seen with diffuse subendocardial ischemia, and suggests that something else, like STEMI from LAD occlusion, could be present. Was this: 1) ACS with ischemia and spontaneous reperfusion?
For those who depend on echocardiogram to confirm the ECG findings of ischemia, this should be sobering. In this case, the duration of ischemia was so brief that there was no such evolution, and there was near-normalization. Ischemia may be so brief that Wellens' waves do not evolve 3. The peak troponin I was 0.364 ng/ml.
Nossen also pointed out that with voltage this high in the limb leads, you would typically expect some degree of inferior/inferolateral ST depression (the so-called "LVH strain" pattern), and in fact this patient did have severe LVH on subsequent echocardiogram (which Dr. Nossen did not know at the time). The troponin peaked at 25749 ng/L.
She underwent exercise echocardiogram in mid October where she exercised for nearly 7 minutes on the standard Bruce protocol and had typical anginal pain and shortness of breath. Baseline echocardiogram showed moderate LV systolic dysfunction with no wall motion abnormalities. There is inferoseptal hypokinesis. link] Shvilkin et al.
Precordial ST depression may be subendocardial ischemia or posterior STEMI. I have warned in the past that one must think of other etiologies of ischemia when there is tachycardia. Whether it is subendocardial ischemia or posterior STEMI, if you cannot get it to resolve, you must activate the cath lab. There is no ST elevation.
This was interpreted by the treating clinicians as not showing any evidence of ischemia. Echocardiogram showed LVEF 66% with normal wall motion and normal diastolic function. He was intubated in the field and sedated upon arrival at the hospital. Here is his presenting ECG: ECG 1, t = 0 What do you think?
Whether these EKGs show myocarditis, a normal variant, or something else, they are overall not typical of transmural ischemia of the anterior or high lateral walls. Additionally, a bedside echocardiogram showed no wall motion abnormality and normal LV function. The patient had none of these conditions.
My interpretation was: RBBB with hyperacute T-waves in V4-V6 that are all but diagnostic of LAD occlusion vs. post ROSC ischemia. Formal Echocardiogram: Normal left ventricular size and wall thickness. The patient had ROSC and maintained it. A 12-lead ECG was obtained: What do you think?
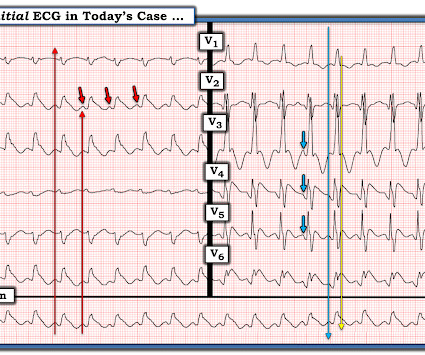
A rapid echocardiogram was performed, revealing an ejection fraction of 20% with thinning of the anterior-apical walls. Learning Point: Concordant ST segment elevation can arise from profound ischemia triggered by ventricular tachycardia (VT), or it may represent an exaggerated basal ST change accompanying tachycardia.
It should be known that each category can easily manifest the generic subendocardial ischemia pattern. In general, subendocardial ischemia is a consequence of global supply-demand mismatch that usually ameliorates upon addressing, and mitigating, the underlying cause. What’s interesting is that the ECG can only detect ischemia.
His response: “subendocardial ischemia. Smith : It should be noted that, in subendocardial ischemia, in contrast to OMI, absence of wall motion abnormality is common. See this case: what do you think the echocardiogram shows in this case? Anything more on history? POCUS will be helpful.” J Electrocardiol 2013;46:240-8 2.
One very useful adjunct is ultrasound: Echo of his heart can distinguish aneurysm from acute MI by presence of diastolic dyskinesis, but it cannot distinguish demand ischemia from ACS. These must raise suspicion of old MI with persistent ST elevation. Troponins peaked at 0.275 ng/ml. An angiogram showed no acute coronary lesions.
or basilar ischemia. Echocardiogram was obtained and showed mild LVH without regional wall motion abnormality. CTA head and neck were obtained and showed no evidence of intracranial hemorrhage, large vessel occlusion stroke (what a helpful and apt name for an acute arterial occlusion paradigm, by the way.), ng/mL and 0.10
The ECG in the chart was read as "no obvious ST changes," (even though no previous ECG was available) and the formal read by the emergency physicians was: "ST deviation and moderated T-wave abnormality, consider lateral ischemia." When the ischemia is resolved, the wall motion may completely recover, or there may be persistent stunning.
When flow is restored, wall motion may completely recover so that echocardiogram does not detect the previous ischemia. Even when the serial troponins are negative, the ECG is critical to the diagnosis of ACS. This is not pericarditis because: a. Pain was typical for MI (substernal, not postional or sharp, resolved with NTG) b.
The ECG shows sinus tachycardia with RBBB and LAFB, without clear additional superimposed signs of ischemia. Hopefully a repeat echocardiogram will be performed outpatient. Chest trauma was suspected on initial exam. Here is his initial ECG around 1330: What do you think? 1900: RBBB and LAFB are almost fully resolved.
The patient has also developed sinus bradycardia, which may result from right coronary artery ischemia to the SA node. Echocardiogram the following day showed a left ventricular ejection fraction of 52% (+/- 5%) with hypokinesis of the basal-mid inferior and inferoseptal myocardium. Two stents were placed with resultant TIMI 3 flow.
However, an echocardiogram is a different test, also conducted for heart activity. Electrocardiogram, echocardiogram, and some other tests are done for patients with cardiac arrest. Poor blood supply Ischemia, or inadequate blood supply to the heart, is an abnormality that can be detected in an ECG test.
EKG initially negative but repeat shows a few T wave abnormalities… There is a chance this could be non-cardiac pain” At 1518, an echocardiogram showed normal LV size and systolic function with hypokinesis of the mid and distal anterior wall and the mid and distal septum.
hours ECG: Not much change hs troponin I peaks at 500 ng/L 8 hours Next morning Urine drug screen: Amphetamine, Methamphetamine, Fentanyl, Fentanyl metabolite Formal Bubble Contrast Echocardiogram: Indications for Study: Silent Ischemia. SUMMARY Normal left ventricular cavity size. Normal estimated left ventricular ejection fraction.
So today i wanted to talk to you about what each heart test tells us about these different aspects of heart disease Tests that tell you about the heart as a pump The most commonly used test to assess the heart as a pump is an echocardiogram. Overall though a normal cardiac MRI is even more reassuring than a normal echocardiogram.
Does this mean that the ST depression in V3 represents "anterior" subendocardial ischemia, and not posterior OMI? Echocardiogram: The estimated left ventricular ejection fraction is 34% Regional wall motion abnormality-lateral, akinetic. non-occlusive ischemia) 2. Thus, they have much less voltage. They have ZERO ST Elevation.
This strongly suggests reperfusing RCA ischemia. Troponins, echocardiogram An echocardiogram showed inferobasilar hypokinesis, further supporting a diagnosis of regional ischemia , likely of the area supplied by the RCA. There is also a Q-wave in III. There is also subtle STD in V3-V5. ng/ml (99th %-ile URL = 0.04
Now you have ECG and troponin evidence of ischemia, AND ventricular dysrhythmia, which means this is NOT a stable ACS. These are reperfusion T-waves (the same thing as Wellens' waves) Echocardiogram Regional wall motion abnormality-distal septum and apex. It they are static, then they are not due to ischemia.
Normally, concavity in ST segments suggests absence of anterior ischemia (though concavity by itself is not reassuring - see this study ). I think a good start would be a posterior EKG and a high quality contrast echocardiogram read by an expert. In there ECG evidence of possible ongoing ischemia? (ie,
Next day, a stress echo was done: The exercise stress echocardiogram is normal. This ST-T wave appearance in the lateral chest leads of ECG #2 is consistent with L V “ S train” vs ischemia. Normal estimated left ventricular ejection fraction improved with stress. No wall motion abnormality at rest.
This proves that the first one was, surprisingly, due to ischemia!! He underwent formal echocardiogram several days later, which confirmed the findings of anterior, and apical wall motion abnormalities. Smith comment: this patient might have been sent home because of the poor sensitivity of this Point of Care (POC) assay.
If you put the inferior and posterior findings together, it is diagnostic of OMI This was read as "inferior ischemia" without any other information by Dr. Richard Gray and as probable reperfused inferior-posterior OMI much later by both me and Pendell Meyers, also without any clinical information.
Pain will resolve with completed infarct or with resolution of ischemia. ECG recorded at 7 hours All active ischemia is gone. Pain will resolve not just with resolution of ischemia, but with completion of infarction. This looks like infarct completion. Patient was placed on a nitro drip and pain remained under control.
Formal echocardiogram showed normal EF, no wall motion abnormalities, no pericardial effusion. The patient proceeded to cath where all coronaries were described as normal with no evidence of any CAD, spasm, or any other abnormality. No more troponins were done. He was found to be influenza positive. 1849 after cath: Brugada pattern is gone!
Next day echocardiogram showed inferolateral hypokinesia with an EF of %45-50. On echocardiogram you will not see a "posterior" hypokinesia (will see "inferolateral") and, as in this case, LCx may not give the blood supply of basal inferior segment (formerly called "posterior"). The patient recovered well. J Am Heart Assoc. 121.022866.
No prior echocardiogram was available for comparison. However, the ST segments in patients with LVH may show significant variation over time in the absence of ischemia. 3 Some have also suggested that the typically asymmetric T wave inversion (TWI) of LVH might be distinguished from the typically symmetric TWI of cardiac ischemia.
We organize all of the trending information in your field so you don't have to. Join thousands of users and stay up to date on the latest articles your peers are reading.
You know about us, now we want to get to know you!
Let's personalize your content
Let's get even more personalized
We recognize your account from another site in our network, please click 'Send Email' below to continue with verifying your account and setting a password.


Let's personalize your content