This site uses cookies to improve your experience. To help us insure we adhere to various privacy regulations, please select your country/region of residence. If you do not select a country, we will assume you are from the United States. Select your Cookie Settings or view our Privacy Policy and Terms of Use.
Cookie Settings
Cookies and similar technologies are used on this website for proper function of the website, for tracking performance analytics and for marketing purposes. We and some of our third-party providers may use cookie data for various purposes. Please review the cookie settings below and choose your preference.
Used for the proper function of the website
Used for monitoring website traffic and interactions
Cookie Settings
Cookies and similar technologies are used on this website for proper function of the website, for tracking performance analytics and for marketing purposes. We and some of our third-party providers may use cookie data for various purposes. Please review the cookie settings below and choose your preference.
Strictly Necessary: Used for the proper function of the website
Performance/Analytics: Used for monitoring website traffic and interactions
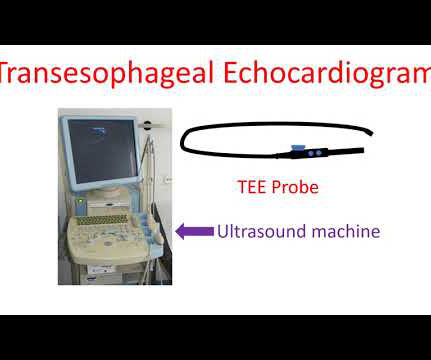
Echocardiogram is an image of the heart using ultrasound. Transesophageal echocardiogram or TEE test, is obtained by introducing a special type of transducer, also called a TEE probe, through the throat into the food pipe (esophagus) and stomach. Usual echocardiogram is obtained by placing the transducer or probe on the chest.
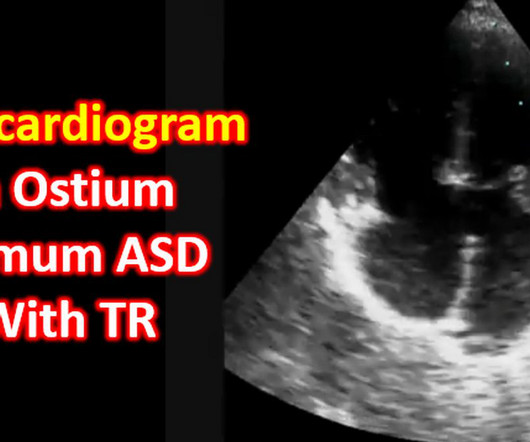
Echocardiogram in ostium primum atrial septal defect with a recap of embryological development of atrial septum. The post Echocardiogram in Ostium Primum ASD With TR appeared first on All About Cardiovascular System and Disorders.
Transcript of the video: Now we will discuss echocardiogram in mitral valve prolapse. Billowing of the mitral leaflets is very well seen in this echocardiogram. It is a fairly common condition. Many of them may have just echo diagnosis without other relevances. Many of them may have just echo diagnosis without other relevances.
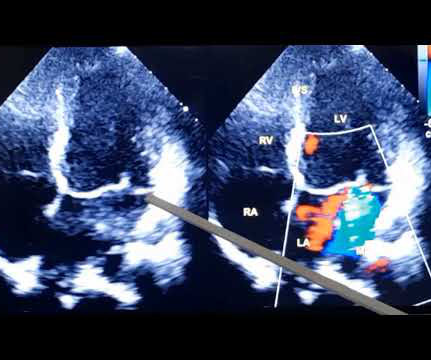
Transcript of the video: This is a still image from a colour Doppler echocardiogram, obtained from the apical five chamber view. These are the features, you have AR jet, and MR jet, in a still image of colour Doppler echocardiogram. Left ventricle, right ventricle, left atrium and part of the aorta.
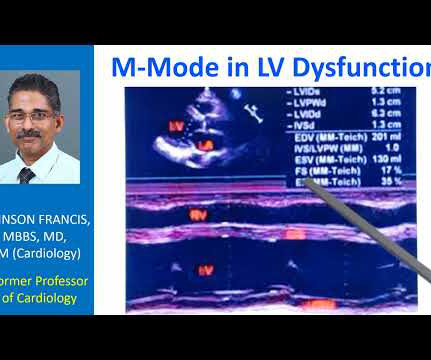
Transcript of the video: This is a still image of M-Mode Echocardiogram. M-Mode is Time-Motion Mode. The horizontal axis is time. Vertical axis is distance from the transducer. That is M-Mode, one of the older modes, currently used mainly for taking left ventricular measurements. In the inset you can see the two dimensional image.
Transcript of the video: This is an apical five chamber view and this is an apical four chamber view. You can see four chambers – RV, LV, RA, LA, and the transducer location is here. And this is five chamber because, in addition you are seeing the aorta also. Right atrium has not been labelled.
Transcript of the video: Closure line of aortic valve on M-Mode echocardiogram, is seen as central line, while in bicuspid aortic valve, it is an eccentric closure, nearer to one of the walls of the aorta. That is an important feature of bicuspid aortic valve on M-Mode echocardiogram. It forms almost like a box or rhomboid shape.
Mostly, they are detected on highly sensitive tests like echocardiogram. In echocardiogram, the Doppler beam can detect this small leak. That is, mild mitral regurgitation and mild aortic regurgitation are less common. Then, these mild tricuspid leaks, are not seen on clinical examination.
Usual colour Doppler echocardiogram is superimposition of colour Doppler images on a two dimensional echocardiogram. Colour M-Mode is superimposition of colour Doppler images on an M-Mode echocardiogram.
Transcript of the video: This is a still image from a colour Doppler echocardiogram, obtained from the apical five chamber view. These are the features, you have AR jet, and MR jet, in a still image of colour Doppler echocardiogram. Left ventricle, right ventricle, left atrium and part of the aorta.
Heart Health: Understanding and Diagnosing Disease by Leveraging Echocardiograms was aimed to raise awareness and estimate the prevalence of cardiovascular disease and associated risk factors among members of the United States, National Football League Alumni Association and their family members through education and screening events.
Ultrasound image of the heart – echocardiogram, showing fluid collection around the heart, marked as PE, short for pericardial effusion. Collection of fluid within the covering of the heart is called pericardial effusion. If it is severe enough to compress the heart, it prevents proper filling of the heart and blood pressure falls.
Similarly, for echocardiogram, what we would do usually is, first we do a clinical history evaluation, then physical examination, and after that only we proceed with echocardiography in our routine work. You can see the two dimensional sector imaging from an echocardiogram and I have marked out the aorta.
The image shown here is an animated 2 dimensional echocardiogram. This one is an older mode known as time-motion mode or M-Mode echocardiogram. An annotated video of normal colour Doppler echocardiogram illustrating various views and an M-Mode tracing is shown here.
Sometimes mild pericardial effusion may be detected by an echocardiogram done for other causes. Pericardial effusion is usually confirmed by an echocardiogram (ultrasound study of the heart). When the quantity is large enough to compress the heart, the person may feel breathless or dizzy because of a fall in blood pressure.
Due to limitations of echocardiogram in evaluating the right ventricle, magnetic resonance imaging study of the right ventricle along with that of the left ventricle has been reported. Effect of exercise on right ventricle. Twenty-one male endurance athletes were compared with untrained control subjects.
Echocardiogram showing thickened interventricular septum and mitral regurgitation in HCM. SAM in HCM Systolic anterior movement of mitral valve occurs in 30 – 60%, but it is not specific.
Echocardiogram in parasternal long axis view shows dilated left ventricle, left atrium, aorta and a small portion of the right ventricle, which is usually the outflow region. Mitral valve leaflets seen in open position between the left ventricle and left atrium are thickened.
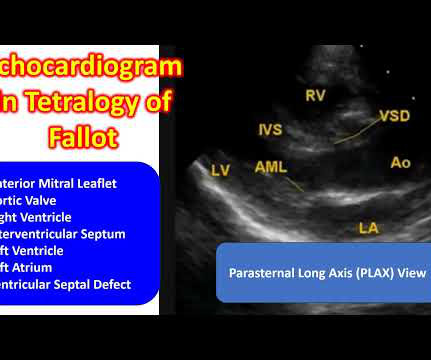
Parasternal long axis view showing colour flow from right ventricle to aorta through the ventricular septal defect with overriding aorta. Flow is predominantly blue in colour because it is away from the transducer kept at the parasternal region.
We organize all of the trending information in your field so you don't have to. Join thousands of users and stay up to date on the latest articles your peers are reading.
You know about us, now we want to get to know you!
Let's personalize your content
Let's get even more personalized
We recognize your account from another site in our network, please click 'Send Email' below to continue with verifying your account and setting a password.


Let's personalize your content