This site uses cookies to improve your experience. To help us insure we adhere to various privacy regulations, please select your country/region of residence. If you do not select a country, we will assume you are from the United States. Select your Cookie Settings or view our Privacy Policy and Terms of Use.
Cookie Settings
Cookies and similar technologies are used on this website for proper function of the website, for tracking performance analytics and for marketing purposes. We and some of our third-party providers may use cookie data for various purposes. Please review the cookie settings below and choose your preference.
Used for the proper function of the website
Used for monitoring website traffic and interactions
Cookie Settings
Cookies and similar technologies are used on this website for proper function of the website, for tracking performance analytics and for marketing purposes. We and some of our third-party providers may use cookie data for various purposes. Please review the cookie settings below and choose your preference.
Strictly Necessary: Used for the proper function of the website
Performance/Analytics: Used for monitoring website traffic and interactions
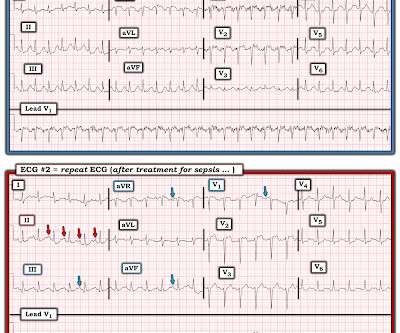
For full discussion of this case — See ECG Blog #220 — == The long lead II rhythm strip shown in Figure-1 was obtained from an 51-year-old man who presented to the ED ( Emergency Department ) with "palpitations" that began 1 hour earlier. Figure: Use of the "3 Simple Rules" for distinction between SVT vs VT ( taken from ECG Blog #196 ).
QUESTIONS: Is this rhythm too fast to be sinus tachycardia? I say this for the simple reason that to pick any of the above 4 choices — is to imply with 100% certainty that you know the answer ( or, as is implied in the title of today’s Blog post — this would be premature closure). Are flutter waves hidden within the QRS and T waves?
The ECG in Figure-1 — was obtained from a middle-aged woman with positional tachycardia and diaphoresis with change of position from suprine to sitting. My THOUGHTS on the ECG in Figure-1: The rhythm is sinus tachycardia at ~105/minute ( ie, The R-R interval is regular — and just under 3 large boxes in duration ).
IMPRESSION: Given the presence of a wide tachycardia — with 2 distinct QRS morphologies, and no sign of P waves — a presumed diagnosis of B i D irectional Ventricular Tachycardia has to be made. As discussed in ECG Blog #231 — Bidirectional VT is a special form of VT, in which there is beat-to-beat alternation of the QRS axis. . =
This leaves us with the usual differential diagnosis for this rhythm presentation ( as per ECG Blog #361 ) ==> We need to consider i ) VT until proven otherwise: ii ) SVT with either preexisting BBB or aberrant conduction; — or , iii ) Something else ( ie, WPW, hyperkalemia, some other toxicity, etc. ). What Kind of Conduction Defect?
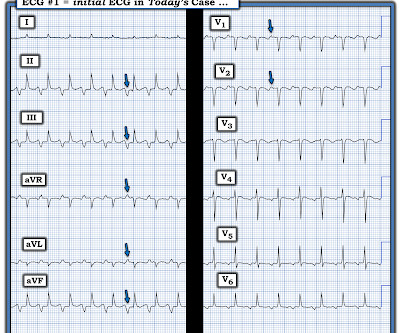
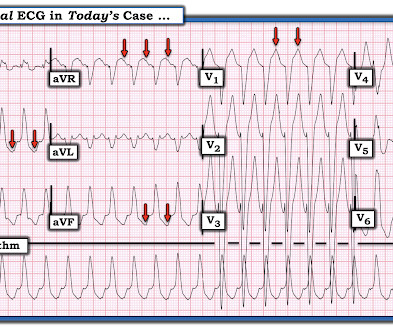
By the P s, Q s, 3 R Approach ( See ECG Blog #185 ): The rhythm is fast and QRS complexes are R egular. PEARL # 4: As emphasized in ECG Blog #204 , in which I review derivation of the bundle branch blocks — RBBB is a terminal conduction delay. Figure-2: I've labeled the initial ECG in today's case. And a Final Tracing.
C linical I MPRESSION: I would interpret ECG #1 as suggestive of near ventricular standstill — with underlying atrial tachycardia, extended pauses, and no reliable ventricular escape focus. R elated E CG B log P osts to Today’s Case : ECG Blog #205 — Reviews my S ystematic A pproach to 12-lead ECG Interpretation.
MY Impression of ECG #1: As emphasized often in this ECG Blog ( See today's ADDENDUM below ) — statistical odds that a regular WCT rhythm without clear sign of sinus P waves will turn out to be VT begin at 80% likelihood. See ECG Blog #287 — if interested in more on ECG recognition of AFlutter ). See text ).
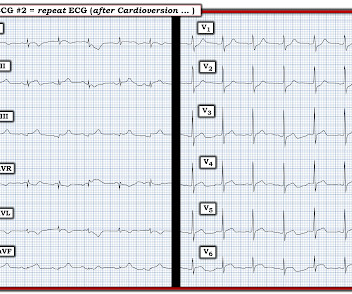
The rhythm is regular — at a rate just over 100/minute = sinus tachycardia ( ie, the R-R interval is just under 3 large boxes in duration ). Continuing with assessment of ECG #1 in Figure-2: The rhythm is sinus tachycardia at ~110/minute. NOTE: Abnormal baseline deflections in Figure-2 are maximal i n leads I , II and aVR.
I see the following: There is sinus tachycardia ( upright P wave with fixed PR interval in lead II ) — at the rapid rate of ~130/minute. See ECG Blog #435 — ECG Blog #313 — as well as My Comment at the bottom of the page in the June 17, 2024 post in Dr. Smith's ECG Blog ). Sinus tachycardia has resolved.
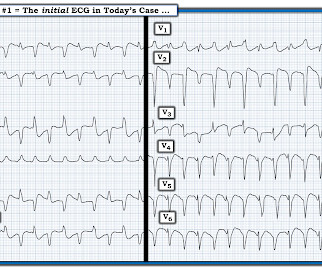
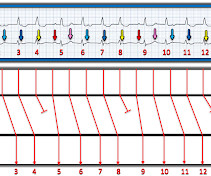
By the P s, Q s, 3 R Approach ( See ECG Blog #185 ): The rhythm in Figure-1 is fast and R egular. By the Every-Other-Beat ( or in this case Every- 3rd -Beat ) Method ( See ECG Blog #210 ) — the R ate of the rhythm is ~250-260/minute ( ie, As shown in Figure-2 — the R-R interval of every 3rd beat is 3.6
PEARL # 2: When the rate of AFib is rapid — this irregular tachycardia may look regular when it is not. ECG Blog #240 — reviews my approach to the ECG assessment of regular SVT rhythms. R elated E CG B log P osts to Today’s Case : ECG Blog #205 — Reviews my S ystematic A pproach to 12-lead ECG Interpretation.
Easy LINKS — tinyurl.com/KG-ECG-Podcasts — [link] — Other ECG Audio PEARLS I previously made for my ECG Blog can be found in the right column of each page on this blog just below this icon — under, "ECG Audio PEARLS". Get a post -conversion 12-lead ECG — and compare this to the initial 12-lead ECG obtained during the tachycardia!
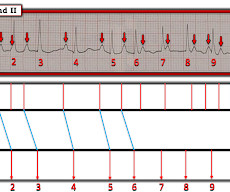
By the P s, Q s & 3 R Approach ( which I review on ECG Blog #185 ): The R ate of the rhythm in Figure-1 is somewhat fast — averaging ~100/minute ( ie, with an R-R interval close to 3 large boxes in duration for most of the tracing ). ECG Blog #229 — reviews distinction between AFlutter vs ATach. P roving M y T heory.
MY Approach to the Rhythm in Figure-1: As per ECG Blog #185 — I favor the P s, Q s, 3 R Approach for interpretation of the cardiac rhythm — beginning with whichever of these 5 KEY Parameters is easiest to assess for the tracing in front of me: At least in the single lead II rhythm strip seen in Figure-1 — The Q RS complex appears to be narrow.
NOTE: For more on ECG recognition of RVH and/or pulmonary hypertension ( re the qR pattern in lead V1 ) — See ECG Blog #234 and Blog #248. Because of this, it is uncommon to see sinus tachycardia with a prolonged PR interval. Unfortunately — my search for 2:1 atrial activity ( as shown in Figure-3 ) was unsuccessful.
Voltage for LVH is satisfied — at least by Peguero Criteria ( Sum of deepest S in any chest lead + S in V4 ≥23 mm in a woman — as discussed in ECG Blog #73 ). This point is particularly relevant regarding ECG #2 — because sinus tachycardia is seen on this earlier ECG. In the October 15, 2022 post of Dr. Smith's ECG Blog — Drs.
PEARL # 1: As emphasized in many other blog posts ( ie, ECG Blog #220 and Blog #196 , to name just two ) the differential diagnosis of a regular WCT rhythm without clear sign of atrial activity should be assumed to be VT ( V entricular T achycardia ) until proven otherwise. See ECG Blog #197 for review of idiopathic VT ).
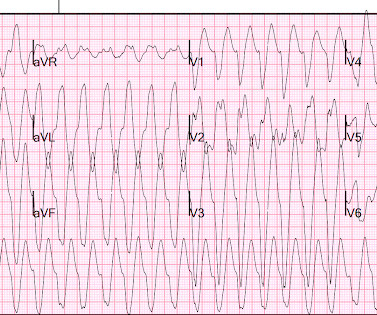
I have previously reviewed a number of cases of "Shark Fin" morphology ( Se e ECG Blog #364 — Blog #410 — Blog #265 — among others ). This ECG shows marked sinus tachycardia with end-cycle ( late-diastolic ) PVCs — and with Shark Fin ST elevation in multiple leads. The "good news" — is that this patient did survive!
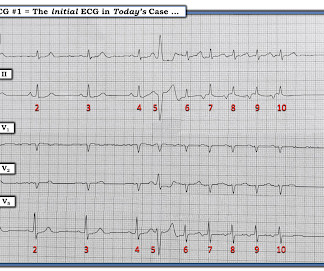
QUESTIONS: Is the wide tachycardia that is seen best in the chest leads, too irregular to be VT ( V entricular T achycardia )? — As reviewed in ECG Blog #231 — QRS morphology in VT may manifest a number of different forms. How certain are YOU of your answer? Figure-1: The initial ECG in today's case. (
With experience, applying the P s, Q s, 3 R Approach ( See ECG Blog #185 ) — to formulate the above steps in our initial assessment of the rhythm in Figure-1 can ( should ) be completed in less than 30 seconds! These are reviewed in ECG Blog #343. I reviewed the concept of Echo beats in ECG Blog #239.
But for those wanting a "simpler" approach" — Consider the following ( which I review below in my ADDENDUM ): This patient is in a wide, "ugly-looking" and seemingly regular tachycardia without P waves. Regarding Q - R - S - T Changes: There is a Q wave in lead III. R wave progression is not normal.
You are shown the ECG in Figure-1 — told only that the patient had a “continuous" tachycardia. The issue of reentry SVT rhythms was discussed in detail in ECG Blog #240. To illustrate the mechanism of atypical "fast-slow" AVNRT — I show below in Figure-3 the laddergram discussed in ECG Blog #240.
Here is her ECG: Regular Wide Complex Tachycardia. Could it be atrial tachycardia with RBBB and LPFB aberrancy? Here it is: There is sinus with normal conduction, very different from her tachycardia. Severely decreased LV function. What do you think? What do you want to do? She was not on any medication that could cause this.
Then I always look to see if the initial deflection of the QRS has a lot of voltage change per change in time (seen in tachycardias that are initiated from above the ventricle because the propagate through fast conducting purkinje fiber. Tachycardia exaggerates ST Elevation in LBBB and Paced rhythm 5. Pacemaker mediated tachycardia!
MY Interpretation of Today's Initial ECG: I've labeled key findings in Figure-2 for today's initial ECG: The rhythm is sinus tachycardia at ~105/minute. The sinus tachycardia is a definite concern that something acute may be ongoing. Does the patient's age infuence your interpretation? Figure-1: The initial ECG in today's case. (
Here is the 12-lead ECG: Wide complex tachycardia What do you think? His pulse on the monitor suddenly went down to 140 and another 12-lead ECG was recorded: Sinus tachycardia at a rate of 143 There are peaked T-waves typical of hyperkalemia The K returned at 6.9 Blood pressure was 117/80, pulse 161, Resp 45, SpO2 100 on oxygen.
There is a regular narrow complex tachycardia. Thus, it is supraventricular tachycardia. It is important to remember that SVT includes Sinus Tachycardia! See many cases with use of Lewis Leads on this blog: Case continued The providers jumped to conclusions and gave adenosine. His pulse was 186. I do not have the strips.
It's important to appreciate that we can not rule out the possibility that this rhythm represents Mobitz II 2nd-degree AV block, in which case the patient will need a pacemaker ( See ECG Blog #236 — for review on the ECG diagnosis of the 2nd-degree AV Blocks ). ECG Blog #192 — The 3 Causes of AV Dissociation. STEP-by-STEP.
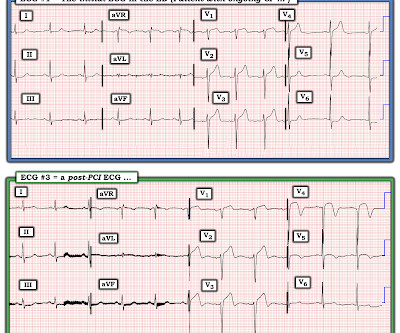
ECG#1 There is a regular tachycardia with a ventricular rate of about 180 bpm. Smith comment : When there is a regular wide complex tachycardia, first assess whether it is sinus or not. Put shortly is SVT with "Shark Fin STE" and not ventricular tachycardia. An ECG was recorded immediately and is shown below. Is there OMI?
For more on Torsades de Pointes vs PMVT See My Comment in the October 18, 2023 post and the September 2, 2024 post in Dr. Smith's ECG Blog ). Even with tachycardia and a paced QRS duration of ~0.16 (J Am Coll Cardiol.
I find AV dissociation in VT to be very difficult to differentiate from artifact, as there are always random blips on tachycardia tracings. Read this post: Idiopathic Ventricular Tachycardias for the EM Physician 2. The 15th beat (2nd beat of V1-V3) appears to be a fusion beat , which is all but diagnostic of VT.
A prehospital 12-lead was recorded: There is a regular wide complex tachycardia. The computer diagnosed this as Ventricular Tachycardia. There is a wide complex regular tachycardia at a rate of 226. Toothache, incidental Wide Complex Tachycardia Could it be fascicular VT or Bundle Branch VT ( i.e., idiopathic VT )?
She had a single chamber ICD/Pacemaker implanted several years prior due to ventricular tachycardia. Answer : The ECG above shows a regular wide complex tachycardia. Said differently, the ECG shows a rather slow ventricular tachycardia with a 2:1 VA conduction. Cardiac output (CO) was being maintained by the tachycardia.
male with pertinent past medical history including Atrial fibrillation, atrial flutter, cardiomyopathy, Pulmonary Embolism, and hypertension presented to the Emergency Department via ambulance for respiratory distress and tachycardia. Description : Regular Wide Complex Tachycardia at a rate of about 160. SVT with aberrancy?
As discussed in detail in ECG Blog #240 — the term, “SVT” — refers to any supraventricular rhythm (ie, with origin at or above the AV node ) that manifests a rate of ≥100/minute. By this definition, a variety of rhythms may qualify as “SVTs” — including sinus tachycardia, atrial flutter or fibrillation, MAT, AVRT/AVNRT, among others.
The ECG and long lead II rhythm strip in Figure-1 — was obtained from a COVID positive patient with persistent tachycardia not responding to Diltiazem. Figure-1: The initial ECG — obtained from a patient with persistent tachycardia. ( ECG Blog #185 — Review of the P s, Q s, 3 R Approach for systematic rhythm interpretation.
A patient in the ICU with significant underlying cardiac disease [HFrEF 30%, non-ischemic cardiomyopathy, LBBB s/p CRT-D (biventricular pacer), AVNRT s/p ablation a few yrs ago, hx sinus tachycardia while on max tolerated BB therapy] went into a regular wide-complex tachycardia after intubation for severe COPD exacerbation. What to do?
By the P s , Q s , 3 R Approach ( See ECG Blog #185 ): The rhythm in Figure-1 is clearly not R egular. PEARL #2: As cited in ECG Blog #252 — my favorite truism in arrhythmia interpretation is, "The commonest cause of a pause is a blocked PAC". ECG Blog #185 — Review of the P s, Q s, 3 R Approach for systematic rhythm interpretation.
As always — I favor a systematic approach to rhythm interpretation, using the P s, Q s, 3 R memory aid ( See ECG Blog #185 ). Now that we know this — we can say the following: The underlying rhythm in Figure-3 is sinus tachycardia at ~105/minute. ECG Blog #185 — Systematic Approach to Rhythm Interpretation.
The terminology favored to describe these ECG findings is diffuse subendocardial ischemia ( See ECG Blog #271 — for more on diffuse subendocardial ischemia ). Smith’s 8/9/2019 post in his ECG Blog. I discussed the findings of acute LMain occlusion further in My Comment in the January 16, 2020 post of Dr. Smith's ECG Blog.
There are 2 “eye-catching” features on the ECG in Figure-1 : Diffuse L ow V oltage : As discussed in detail in ECG Blog #272 — a series of clinical conditions have been associated with low voltage on ECG. R elated E CG B log P osts to Today’s Case : ECG Blog #205 — Reviews my S ystematic A pproach to 12-lead ECG Interpretation.
As always — I like to start by focusing on the long lead rhythm strip — which shows a bigeminal rhythm — in that there are repetitive 2-beat groups ( See ECG Blog #232 for review of the concept of “bigeminy” ). PEARL # 1: As discussed in ECG Blog #232 — it helps to consider the differential diagnosis of a bigeminal rhythm.
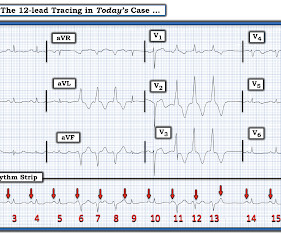
NOTE: The ECG in Figure-1 has been recorded at the usual 25mm/second speed — but with the Cabrera format ( Please see my Editorial Note near the top of the page in ECG Blog #365 for review of the basics of this recording system ). ECG Blog #185 — Review of the P s, Q s, 3 R Approach for systematic rhythm interpretation.
We organize all of the trending information in your field so you don't have to. Join thousands of users and stay up to date on the latest articles your peers are reading.
You know about us, now we want to get to know you!
Let's personalize your content
Let's get even more personalized
We recognize your account from another site in our network, please click 'Send Email' below to continue with verifying your account and setting a password.


Let's personalize your content