This site uses cookies to improve your experience. To help us insure we adhere to various privacy regulations, please select your country/region of residence. If you do not select a country, we will assume you are from the United States. Select your Cookie Settings or view our Privacy Policy and Terms of Use.
Cookie Settings
Cookies and similar technologies are used on this website for proper function of the website, for tracking performance analytics and for marketing purposes. We and some of our third-party providers may use cookie data for various purposes. Please review the cookie settings below and choose your preference.
Used for the proper function of the website
Used for monitoring website traffic and interactions
Cookie Settings
Cookies and similar technologies are used on this website for proper function of the website, for tracking performance analytics and for marketing purposes. We and some of our third-party providers may use cookie data for various purposes. Please review the cookie settings below and choose your preference.
Strictly Necessary: Used for the proper function of the website
Performance/Analytics: Used for monitoring website traffic and interactions
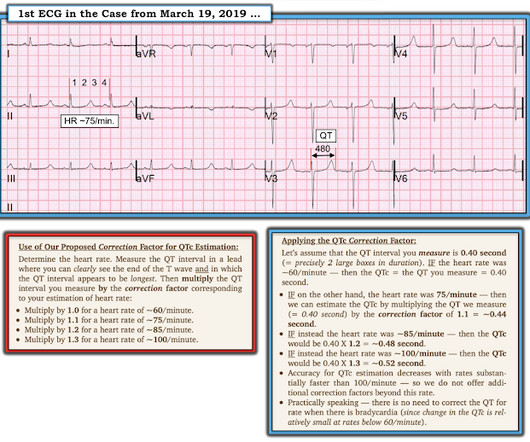
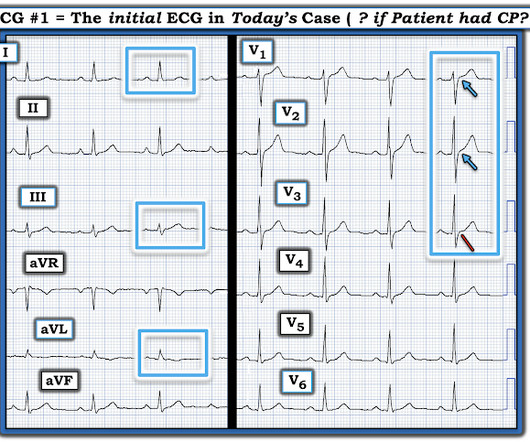
That said — the ECG in Figure-1 should prompt the following considerations: The symmetric chest lead T wave inversion in ECG #1 could be a sign of coronary disease, potentially with acute ischemia. See ECG Blog #313 — as well as My Comment at the bottom of the page in the June 17, 2024 post in Dr. Smith's ECG Blog ).
As discussed in ECG Blog #231 — Bidirectional VT is a special form of VT, in which there is beat-to-beat alternation of the QRS axis. Acute myocardial ischemia. See My Comment in the June 1, 2020 post in Dr. Smith's ECG Blog — for review of Pleomorphic VT. CPVT ( Catecholaminergic PolyMorphic VT ). Cardiac Sarcoidosis.
For full discussion of this case — See ECG Blog #351 — == The ECG in Figure-1 — was obtained from a previously healthy older man who contacted EMS ( E mergency M edical S ervices ) because of "chest tightness" that began ~1 hour earlier. ECG Blog #205 = The Systematic Approach I favor. Below are slides used in my video presentation.
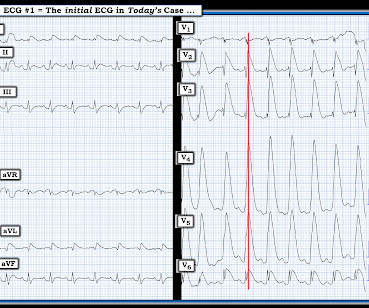
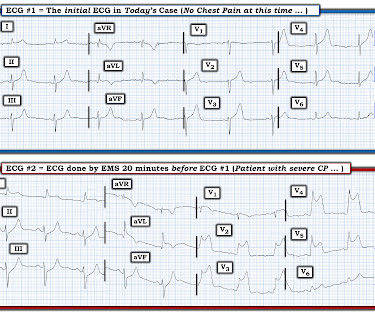
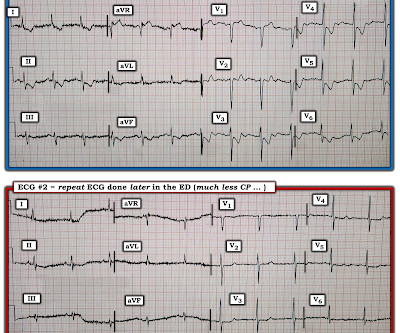
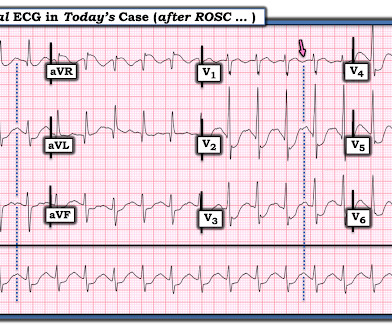
For full discussion of this case — See ECG Blog #392 — == The ECG in Figure-1 was obtained from a man in his 60s — who described the sudden onset of "chest tightness" that began 20 minutes earlier, but who now ( at the time this ECG was recorded ) — was no longer having symptoms. ECG Blog #387 — Dynamic change in 2 minutes.
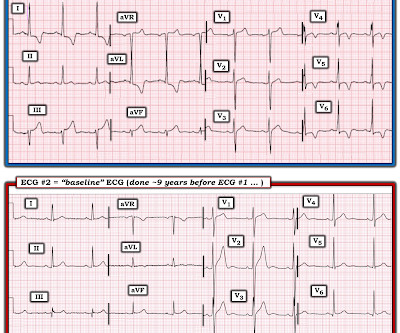
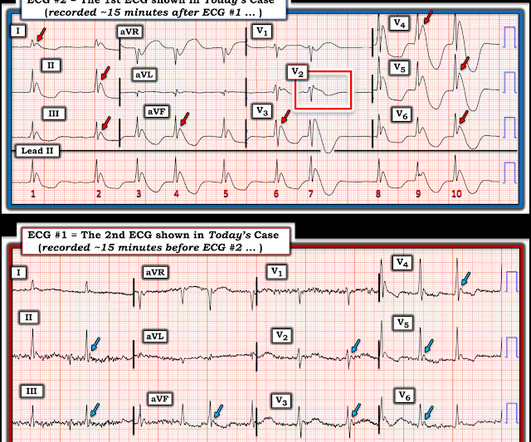
For full discussion of this case — See ECG Blog #292 — == The 2 ECGs shown in Figure-1 were obtained from a man in his 30s — who presented to the ED ( E mergency D epartment ) with chest pain that began several hours earlier. Related ECG Blog Posts to Today’s Case: ECG Blog #205 — Reviews my Systematic Approach to 12-lead ECG Interpretation.
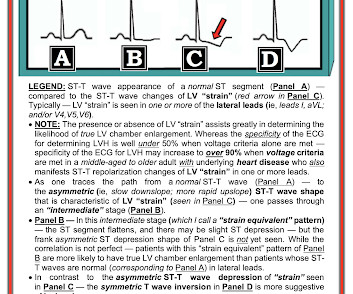
For more regarding ECG criteria for LVH — See the ADDENDUM below and/or ECG Blog #73 and ECG Blog #245. My written interpretation on a tracing such as this one would read, "Marked LVH and 'strain' and/or ischemia — with need for clinical correlation."
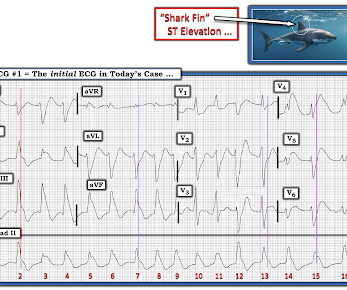
As discussed in ECG Blog #364 and ECG Blog #265 — We are looking at " Shark Fin " ST elevation! Shark Fin" ST segment elevation is most often a sign of severe transmural ischemia that results from acute coronary occlusion. ECG Blog #265 and ECG Blog #364 — Review cases of Shark-Fin ST Elevation.
By the P s, Q s, 3 R Approach ( which I review in ECG Blog #185 ): Lots of P waves are present — being well seen in the long lead II rhythm strip. This slight variation in sinus P wave regularity tends to be greater when a 2nd- or 3rd-degree AV block is present ( called ventriculophasic sinus arrhythmia — as shown in ECG Blog #344 ).
To do this — I apply the P s, Q s, 3 R Approach ( See ECG Blog #185 — for review of my system ). As a result — IF no "fixable" cause is found ( ie, ischemia/infarction — electrolyte disturbance — rate-slowing medication ) — then because of the AV block and very slow heart rate, this patient will probably need a pacemaker.
Voltage for LVH is satisfied — at least by Peguero Criteria ( Sum of deepest S in any chest lead + S in V4 ≥23 mm in a woman — as discussed in ECG Blog #73 ). Smith's ECG Blog — Drs. Figure-3: Selected sets of V1,V2 leads from the examples of Precordial Swirl provided in the October 15, 2022 post in Dr. Smith's ECG Blog.
As discussed in many posts in this ECG Blog — despite not satisfying the millimeter-based definition of a STEMI — in this patient with new chest pain, the ECG findings in Figure-1 merit prompt cath lab activation without any need to wait for serum troponin to return elevated ( See ECG Blog #193 — regarding the new "OMI" paradigm ).
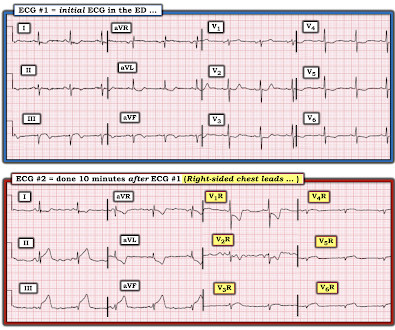
PEARL # 3: While not 100% predictive — seeing a significant negative component to the P wave in these leads ( as per the YELLOW arrows in Figure-2 ) — suggests that the V1,V2 electrodes may be placed 1 or 2 interspaces too high on the chest ( See ECG Blog #274 — for more on too high placement of the V1,V2 electrode leads ). Smith's ECG Blog.
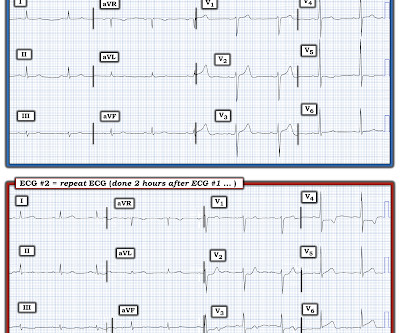
As a result, the ST elevation ( with especially tall, peaked T wave in lead V2) — is not indication of acute ischemia. As suggested by Figure-4 below in the ADDENDUM — assessment of the ST-T waves in leads V2,V3 and V5,V6 — is consistent with ischemia and / or LV "strain". ECG Blog #73 — Reviews "My Take" on the ECG Diagnosis of LVH.
PEARL # 1: Although seeing an elevated Troponin would provide additional support for immediate cardiac catheterization — the clinical reality is that the initial Troponin reading will not always be elevated in patients with acute coronary occlusion ( See March 24, 2023 post in Dr. Smith's ECG Blog ).
This suggests ischemia of uncertain duration. Given this patient's older age — if nothing "fixable" is found, she most likely has SSS ( S ick S inus S yndrome ) and will need a pacemaker ( See ECG Blog #342 for more on SSS ). See ECG Blog #188 for review on how to read and/or draw Laddergrams ). A permanent pacemaker was placed.
This is because clinicians ( including too many cardiologists ) have trouble accepting the fact that a young patient can have an acute MI ( See case discussion in the January 9, 2023 post in Dr. Smith's ECG Blog — with links at the bottom of this post to a series of more cases illustrating this phenomenon ).
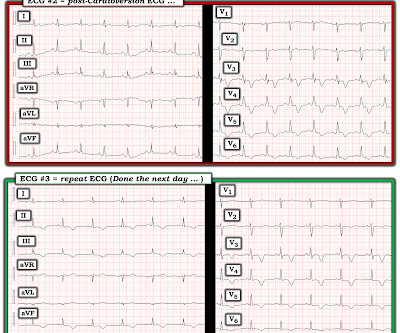
This confirms that the pain was ischemia and is now resovled. For more on MINOCA — See My Comment in the November 16, 2023 post in Dr. Smith's ECG Blog ). The cardiology fellow agreed with plan for emergent cath and escorted the patient to the cath lab. The i nitial hs troponin I returned 75%.
ischemia) or it can be secondary to abnormal depolarization (e.g Discussion: The ECG in today's case does not have typical ST depression vector of diffuse subendocardial ischemia. The ST vector in subendocardial ischemia (SEI) usually has the largest amount of ST depression in leads II and V5, towards the apex of the heart. (ST
This ST depression appears to be maximal in leads V3-to-V5 — which could reflect acute posterior OMI ( O cclusion-based M yocardial I nfarction ) — most probably with multi -vessel disease ( ie, diffuse subendocardial ischemia suggested by the ST depression with ST elevation in aVR>V1 ). ECG Blog #316 — The patient died.
The terminology favored to describe these ECG findings is diffuse subendocardial ischemia ( See ECG Blog #271 — for more on diffuse subendocardial ischemia ). Smith’s 8/9/2019 post in his ECG Blog. R elated E CG B log P osts to Today’s Case : ECG Blog #205 — Reviews my S ystematic A pproach to 12-lead ECG Interpretation.
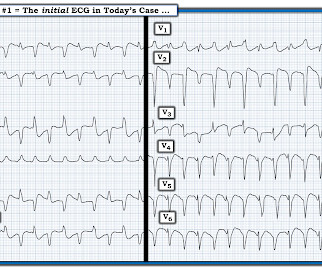
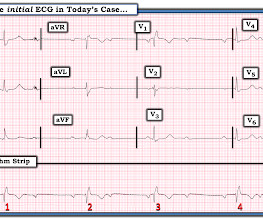
== P lease N OTE : After today — No new ECG Blog posts for 2- to -3 weeks. — I will also not be prompt in replying to emails. == All material on this ECG Blog site remains open! IF you scroll down a little on the right-hand column of this blog — You'll see a lot of icons. Figure-1: The initial ECG in today's case.
Although this " Imbalance " of precordial T waves is not see n very often — in the “right” clinical setting, it has been associated with recent OMI ( O cclusion-based MI ) , most often from a LCx culprit artery ( See Manno et al: JACC 1:1213, 1983 — and the July 17, 2013 post by Salim Rezaie in ALiEM — and ECG Blog #350 ).
M Y T houghts on the ECG in Figure-1: I have presented similar ECGs to the one in today's tracing on several occasions ( most recently in ECG Blog #284 ). Discussion of the pros and cons of these various agents extends beyond the scope of this ECG Blog. I have synthesized what I find the BEST from these programs in my ECG Blog #76.
FOR O ther E xamples of Acute RV MI: Discussion of the 12-lead ECG in Blog #187 — See Figure-4 in ECG Blog #80 ( More on the "culprit" artery in this post ) — See ECG Blog #141 — Figure-5 ( together with Figure-6 ): Reviews the ECG Essentials of RV MI ( Excerpted from my ECG-2014-ePub ).
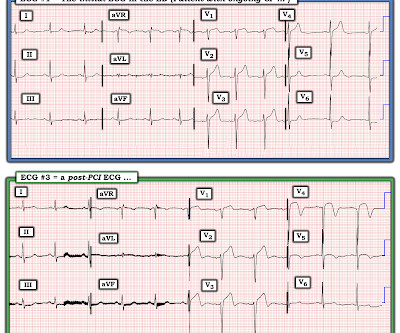
R elated E CG B log P osts to Today’s Case : ECG Blog #205 — Reviews my S ystematic A pproach to 12-lead ECG Interpretation. ECG Blog #193 — illustrates use of the M irror T est to facilitate recognition of acute Posterior MI. ECG Blog #294 — How to tell IF the "culprit" artery has reperfused.
By the P s, Q s, 3 R Approach ( as reviewed in ECG Blog #185 ): The Q RS complex is obviously wide. ie, Severe subendocardial ischemia from sustained VT in a patient severe apical cardiomyopathy resulted in a peak troponin >31,000 ng/L in today's case ). . = I do not see P waves. The rhythm is R egular — at a R ate of ~230/minute.
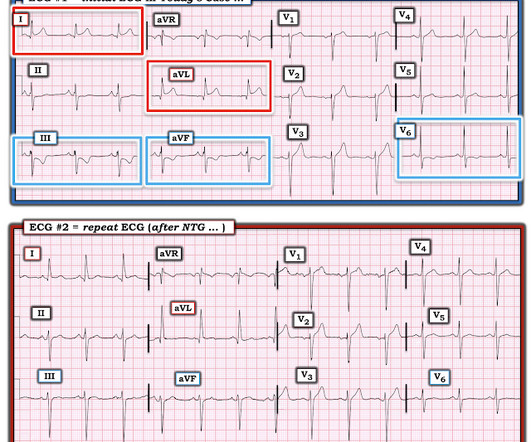
The overall ST-T wave appearance in this lead looks more like LV “strain” than ischemia. In a patient with new chest pain — this ST-T wave appearance in lead V2 of ECG #2 is consistent with a positive " Mirror " Test ( as described in ECG Blog #285 — as well as in other Related ECG Blog links provided below ).
With experience, applying the P s, Q s, 3 R Approach ( See ECG Blog #185 ) — to formulate the above steps in our initial assessment of the rhythm in Figure-1 can ( should ) be completed in less than 30 seconds! These are reviewed in ECG Blog #343. I reviewed the concept of Echo beats in ECG Blog #239.
The Long Lead II Rhythm Strip: As always — I favor a systematic approach to rhythm interpretation, using the P s, Q s, 3 R memory aid ( See ECG Blog #185 ). The other main consideration — is to take another look at the 12-lead ECG, and assess this for recent ischemia or infarction.
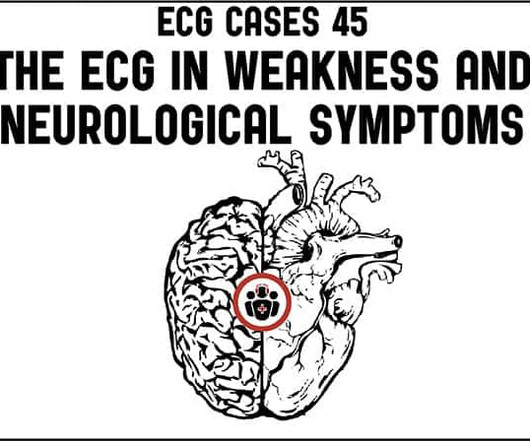
In this ECG Cases blog Dr. Jesse MacLaren guides us through 10 cases of patients who present with generalized weakness or acute neurologic symptoms and discusses how to look for ECG signs of dysrhythmias, electrolyte emergencies, acute coronary occlusion, and demand ischemia in patients with generalized weakness and in patients with neurologic symptoms, (..)
PEARL # 6: As I discuss in my review of SSS ( See ECG Blog #342 for details ) — establishing a diagnosis that sinus bradycardia indicates SSS — will depend on the following: Finding out the age of the patient ( ie, SSS is most common in older individuals ) — and learning whether the patient has been symptomatic?
"Shark Fin" ST segment elevation is most often a sign of severe transmural ischemia that results from acute coronary occlusion. Additional Relevant ECG Blog Posts to Today’s Case: ECG Blog #185 — Reviews my System for Rhythm Interpretation , us ing the P s, Q s & 3 R Approach.
In EM Cases' first ECG Cases blog we review 7 examples of ECGs of patients presenting to the ED with chest pain, who's ECG were read as normal by the computer. And guess what.they all show acute ischemia!
The ECG shows severe ischemia, possibly posterior OMI. But cardiac arrest is a period of near zero flow in the coronary arteries and causes SEVERE ischemia. It takes time for that ischemia to resolve. The patient was brought to the ED and had this ECG recorded: What do you think? And what do you want to do?
It should be kept in mind that on occasions, beta-one agonist can result in increased ventricular ectopy e.g., in severe myocardial ischemia (by increasing myocardial demand), or sometimes with congenital long-QT syndrome. Smith, this can be accomplished by either using beta-one agonists or temporary transvenous pacing.
Looking Systematically ( as per ECG Blog #205 ): The rhythm is sinus. I thought this finding consistent with the finding of ST depression in lateral leads I; V4,V5,V6 — and possibly indicative of multivessel disease ( ie, Diffuse Subendocardial Ischemia — as discussed in ECG Blog #400 ).
This case shows a CT image of subendocardial ischemia. The post cath ECG was not recorded until the next morning: The ischemia is almost entirely resolved. The inferior and posterior walls are also at chronic risk of subendocardial ischemia because of this tenuous blood supply. No evidence for watershed ischemia.
In this ECG Cases blog we look at 10 patients with shortness of breath, and discuss how the ECG can be used to help diagnose cardiac, respiratory and metabolic emergencies.
This was sent by an undergraduate (not yet in medical school, but applying now) who works as an ED technician (records all EKGs, helps with procedures, takes vital signs) and who reads this blog regularly. This EKG is diagnostic of transmural ischemia of the inferior wall. Edited by Smith He also sent me this great case.
An undergraduate (not yet in medical school) who works as an ED technician (records all EKGs, helps with procedures, takes vital signs) and who reads this blog regularly arrived at work and happened to glance down and see this previously recorded ECG on a table in the ED. It was recorded at 0530: What do you think?
The ECG does not show any definite signs of ischemia. IMPRESSION: The finding of sinus bradycardia with 1st-degree AV block + marked sinus arrhythmia + the change in PR interval from beat #5-to-beat #6 — suggests a form of vagotonic block ( See My Comment in the October 9, 2020 post in Dr. Smith's ECG Blog ).
No ischemia. This is a conundrum, because it is clear that the patient is having an acute MI, the ECG is dynamic, but the pain is very mild and there is no ECG evidence of active transmural ischemia. We already know that the ischemia is ongoing, though mild (because of the persistent pain). Q-waves are even more pronounced.
See our other blog posts of hypothermia and Osborn waves -- Massive Osborn Waves of Severe Hypothermia (23.6 We've discussed Osborn Waves ( both ischemic and hypothermic ) — on a number of occasions in Dr. Smith's ECG Blog ( Please check out My Comment at the bottom of the page in the February 8, 2022 post ).
There may be ischemia present, but it is not evident on the ECG. In this paper, Dr. Birnbaum writes: "In patients with ACS without LVH, ST depression with negative T waves in the lateral leads is a sign of sub-endocardial ischemia and is an independent predictor of adverse outcome [11 – 13].
We organize all of the trending information in your field so you don't have to. Join thousands of users and stay up to date on the latest articles your peers are reading.
You know about us, now we want to get to know you!
Let's personalize your content
Let's get even more personalized
We recognize your account from another site in our network, please click 'Send Email' below to continue with verifying your account and setting a password.


Let's personalize your content