This site uses cookies to improve your experience. To help us insure we adhere to various privacy regulations, please select your country/region of residence. If you do not select a country, we will assume you are from the United States. Select your Cookie Settings or view our Privacy Policy and Terms of Use.
Cookie Settings
Cookies and similar technologies are used on this website for proper function of the website, for tracking performance analytics and for marketing purposes. We and some of our third-party providers may use cookie data for various purposes. Please review the cookie settings below and choose your preference.
Used for the proper function of the website
Used for monitoring website traffic and interactions
Cookie Settings
Cookies and similar technologies are used on this website for proper function of the website, for tracking performance analytics and for marketing purposes. We and some of our third-party providers may use cookie data for various purposes. Please review the cookie settings below and choose your preference.
Strictly Necessary: Used for the proper function of the website
Performance/Analytics: Used for monitoring website traffic and interactions
This leaves us with the usual differential diagnosis for this rhythm presentation ( as per ECG Blog #361 ) ==> We need to consider i ) VT until proven otherwise: ii ) SVT with either preexisting BBB or aberrant conduction; — or , iii ) Something else ( ie, WPW, hyperkalemia, some other toxicity, etc. ). What Kind of Conduction Defect?
And as per ECG Blog #350 — this could represent Wellens ' Syndrome IF this chest lead T wave inversion was new and occurred in a patient who initially had a normal ECG, and then had an episode of transient CP that had resolved at the time this ECG with chest lead T wave inversion was recorded.
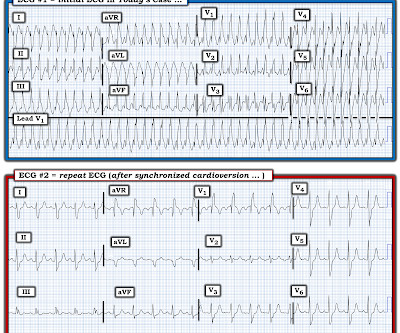
For full discussion of this case — See ECG Blog #220 — == The long lead II rhythm strip shown in Figure-1 was obtained from an 51-year-old man who presented to the ED ( Emergency Department ) with "palpitations" that began 1 hour earlier. Figure: Use of the "3 Simple Rules" for distinction between SVT vs VT ( taken from ECG Blog #196 ).
I say this for the simple reason that to pick any of the above 4 choices — is to imply with 100% certainty that you know the answer ( or, as is implied in the title of today’s Blog post — this would be premature closure). ECG Blog #240 — The regular SVT. ECG Blog #229 — Why is AFlutter so commonly overlooked? s in Figure-2 ).
PEARL # 1: As I emphasize in ECG Blog #148 ( from where I took the tracing I show in Figure-3 ) — the BEST way to prove artifact — is to recognize persistence of an underlying spontaneous rhythm that is unaffected by any erratic or suspicious deflections that are seen. Figure-3: I've reproduced this tracing from ECG Blog #148 ( See text ). =
As is also emphasized often in this ECG Blog — spontaneous reperfusion of the "culprit" artery is common — and, IF this occurs before a 2nd ECG is done, ST-T wave changes may "look better" ( See References to related Blog posts below ). ECG Blog #294 — Reviews how to tell IF the " culprit " artery has reperfused.
As discussed in ECG Blog #231 — Bidirectional VT is a special form of VT, in which there is beat-to-beat alternation of the QRS axis. See My Comment in the June 1, 2020 post in Dr. Smith's ECG Blog — for review of Pleomorphic VT. Multifocal vs Polymorphic VT — September 23, 2011 post from Dr. S.
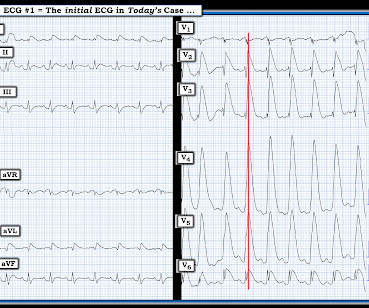
MY Impression of ECG #1: As emphasized often in this ECG Blog ( See today's ADDENDUM below ) — statistical odds that a regular WCT rhythm without clear sign of sinus P waves will turn out to be VT begin at 80% likelihood. See ECG Blog #287 — if interested in more on ECG recognition of AFlutter ). How Would You Treat this Patient?
PEARL # 2: As described in ECG Blog #394 — QRS widening in the presence of sinus rhythm, in which QRS morphology is consistent with RBBB conduction in the chest leads — but LBBB conduction in the limb leads ( especially with a leftward axis ) — suggests the entity known as MBBB ( M asquerading B undle B ranch B lock ).
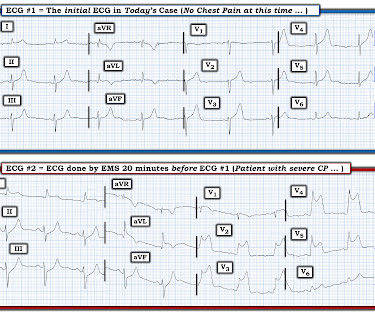
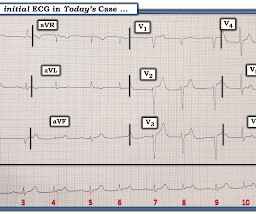
For full discussion of this case — See ECG Blog #351 — == The ECG in Figure-1 — was obtained from a previously healthy older man who contacted EMS ( E mergency M edical S ervices ) because of "chest tightness" that began ~1 hour earlier. ECG Blog #205 = The Systematic Approach I favor. Below are slides used in my video presentation.
By the P s, Q s, 3 R Approach ( See ECG Blog #185 ): The rhythm is fast and QRS complexes are R egular. PEARL # 4: As emphasized in ECG Blog #204 , in which I review derivation of the bundle branch blocks — RBBB is a terminal conduction delay. ECG Blog #185 — Reviews the P s, Q s, 3 R Approach to Rhythm Interpretation.
As I review in ECG Blog #204 — “typical” LBBB is characterized by a supraventricular rhythm with QRS widening, in which there is a monophasic R wave in left-sided leads I and V6 — and an all-negative ( or almost all negative ) QRS in right-sided lead V1. ECG Blog #294 — Reviews how to tell IF the " culprit " artery has reperfused.
KEY Point: Although true that patients with longstanding, severe pulmonary disease may manifest a QRST complex in standard lead I with marked overall reduction in QRST amplitude ( See ECG Blog #65 — regarding Schamroth’s Sign ) — you should never normally see a completely flat line in any of the standard limb leads.
Regarding the 1 2- L ead E CG: Applying the systematic approach I favor for 12-lead ECG interpretation ( as detailed in ECG Blog #205 ): Rate & Rhythm: As stated above — there is a regular, supraventricular rhythm with some P waves, group beating, and an acceptable overall ventricular rate between ~60-80/minute. I begin with Figure-5.
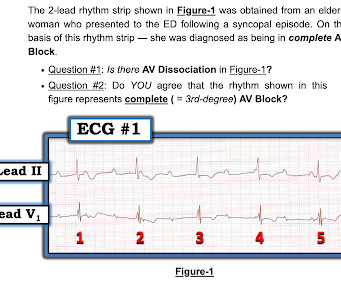
For full discussion of this case — See ECG Blog #191 — == The 2-lead rhythm strip shown in Figure-1 was obtained from an elderly woman who presented to the ED following a syncopal episode. ECG Media Pearl # 8 ( 8:20 minutes Video ) — ECG Blog #191 — Distinguishing between A V D issociation vs Complete AV Block ( 2/6/2021 ).
I favor starting with the long lead II rhythm strip — by use of the P s, Q s, 3 R Approach ( See ECG Blog #185 for more on the Ps, Qs, 3Rs ). For more on the " Footprints " of Wenckebach — See ECG Blog #164. R elated E CG B log P osts to Today’s Case : ECG Blog #205 — Reviews my S ystematic A pproach to 12-lead ECG Interpretation.
For more regarding ECG criteria for LVH — See the ADDENDUM below and/or ECG Blog #73 and ECG Blog #245. A bout H CM ( Different Forms of this Entity ): I've excerpted what appears below from My Comment in the December 26, 2023 post in Dr. Smith's ECG Blog. ECG Blog #245 — Reviews the ECG diagnosis of LVH.
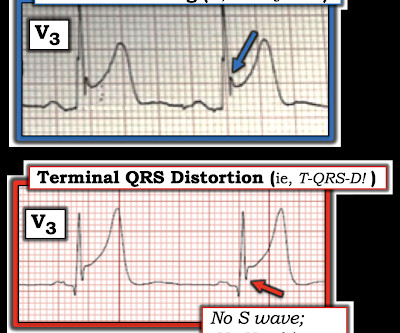
I i llustrate the ECG finding of T-QRS-D below in Figure-3 , which I've excerpted from My Comment in the November 14, 2019 post in Dr. Smith's ECG Blog. Today's case is also noteworthy in that T-QRS-D is seen in association with RBBB — which has only been described on rare occasions ( See the March 28, 2021 post i n Dr. Smith's ECG Blog ).
As discussed in detail in ECG Blog #228 — this seemingly qualifies as a “ Silent ” MI ( Approximately half of those MIs not accompanied by CP — have some other associated symptom such as syncope, which substitutes as a “chest pain equivalent” ). ECG Blog #218 — Reviews HOW to define a T wave as being H yperacute ? What is T-QRS-D?
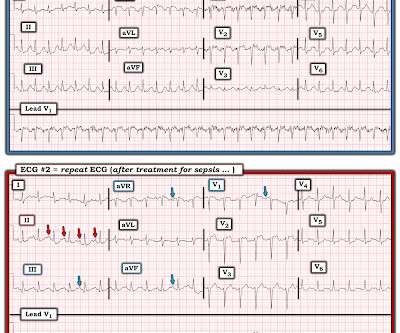
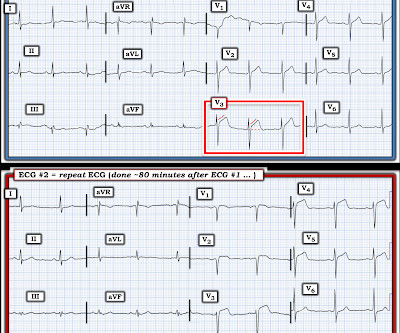
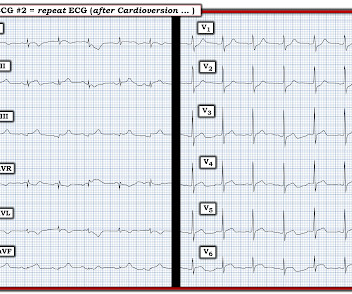
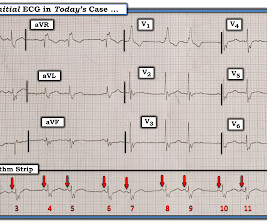
For full discussion of this case — See ECG Blog #292 — == The 2 ECGs shown in Figure-1 were obtained from a man in his 30s — who presented to the ED ( E mergency D epartment ) with chest pain that began several hours earlier. Related ECG Blog Posts to Today’s Case: ECG Blog #205 — Reviews my Systematic Approach to 12-lead ECG Interpretation.
As discussed in ECG Blog #364 and ECG Blog #265 — We are looking at " Shark Fin " ST elevation! Alternatively — the shape of the ST elevation in lead V2 might also be consistent with a component of Brugada Phenocopy ( See ECG Blog #238 ). ECG Blog #265 and ECG Blog #364 — Review cases of Shark-Fin ST Elevation.
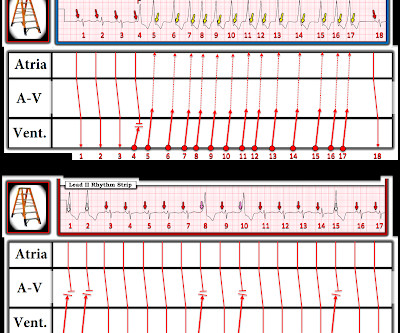
By the P s, Q s, 3 R Approach ( which I review in ECG Blog #185 ): Lots of P waves are present — being well seen in the long lead II rhythm strip. This slight variation in sinus P wave regularity tends to be greater when a 2nd- or 3rd-degree AV block is present ( called ventriculophasic sinus arrhythmia — as shown in ECG Blog #344 ).
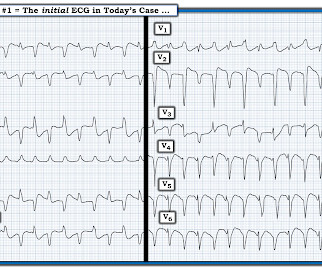
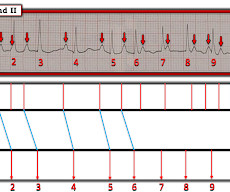
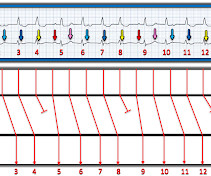
By the P s, Q s, 3 R Approach ( See ECG Blog #185 ): The rhythm in Figure-1 is fast and R egular. By the Every-Other-Beat ( or in this case Every- 3rd -Beat ) Method ( See ECG Blog #210 ) — the R ate of the rhythm is ~250-260/minute ( ie, As shown in Figure-2 — the R-R interval of every 3rd beat is 3.6 ECG Blog #35 — Review of RVOT VT.
An example of a case in which the diagnosis of acute OMI was made purely by assessment of ST-T wave morphology in a PVC can be found HERE ( See My Comment at the bottom of this page in the October 8, 2018 post in Dr. Smith's ECG Blog ). = ECG Blog #294 — Reviews how to tell IF the " culprit " artery has reperfused.
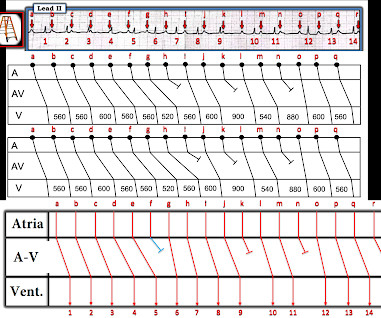
To do this — I apply the P s, Q s, 3 R Approach ( See ECG Blog #185 — for review of my system ). Explanation of the Laddergram in Figure-4: For those in search of a review on reading and/or drawing Laddergrams — Please check out my ECG Blog #188. ECG Blog #185 — Reviews the P s, Q s, 3 R Approach to Rhythm Interpretation.
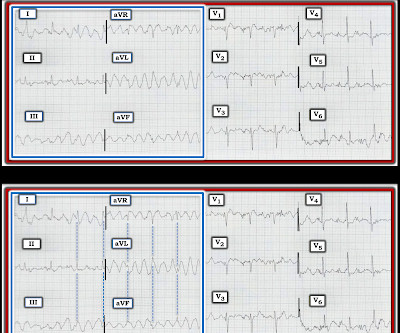
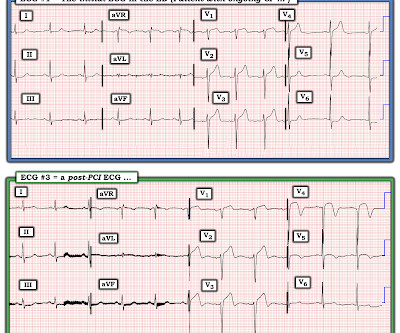
For full discussion of this case — See ECG Blog #392 — == The ECG in Figure-1 was obtained from a man in his 60s — who described the sudden onset of "chest tightness" that began 20 minutes earlier, but who now ( at the time this ECG was recorded ) — was no longer having symptoms. ECG Blog #387 — Dynamic change in 2 minutes.
Regarding ST-T Wave Changes in Figure-2: As per the title of today's ECG Blog — one KEY lead "tells the tale". R elated E CG B log P osts to Today’s Case : ECG Blog #205 — Reviews my S ystematic A pproach to 12-lead ECG Interpretation. ECG Blog #294 — Reviews how to tell IF the " culprit " artery has reperfused.
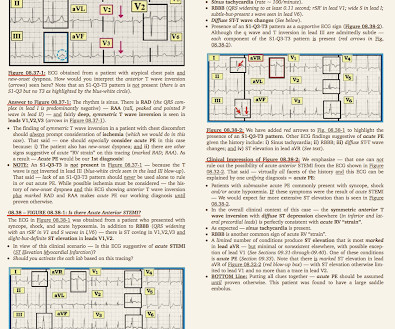
As discussed in many posts in this ECG Blog — despite not satisfying the millimeter-based definition of a STEMI — in this patient with new chest pain, the ECG findings in Figure-1 merit prompt cath lab activation without any need to wait for serum troponin to return elevated ( See ECG Blog #193 — regarding the new "OMI" paradigm ).
MY Approach to the Rhythm in Figure-1: As per ECG Blog #185 — I favor the P s, Q s, 3 R Approach for interpretation of the cardiac rhythm — beginning with whichever of these 5 KEY Parameters is easiest to assess for the tracing in front of me: At least in the single lead II rhythm strip seen in Figure-1 — The Q RS complex appears to be narrow.
Voltage for LVH is satisfied — at least by Peguero Criteria ( Sum of deepest S in any chest lead + S in V4 ≥23 mm in a woman — as discussed in ECG Blog #73 ). In the October 15, 2022 post of Dr. Smith's ECG Blog — Drs. I've reviewed my approach to the ECG diagnosis of LVH ofte n ( See ECG Blog #245 — among many other posts ).
ECG Blog #240 — reviews my approach to the ECG assessment of regular SVT rhythms. R elated E CG B log P osts to Today’s Case : ECG Blog #205 — Reviews my S ystematic A pproach to 12-lead ECG Interpretation. ECG Blog #185 — Reviews the P s, Q s, 3 R Approach to Rhythm Interpretation.
By the P s, Q s & 3 R Approach ( which I review on ECG Blog #185 ): The R ate of the rhythm in Figure-1 is somewhat fast — averaging ~100/minute ( ie, with an R-R interval close to 3 large boxes in duration for most of the tracing ). ECG Blog #229 — reviews distinction between AFlutter vs ATach.
PEARL # 3: While not 100% predictive — seeing a significant negative component to the P wave in these leads ( as per the YELLOW arrows in Figure-2 ) — suggests that the V1,V2 electrodes may be placed 1 or 2 interspaces too high on the chest ( See ECG Blog #274 — for more on too high placement of the V1,V2 electrode leads ). Smith's ECG Blog.
See ECG Blog #435 — ECG Blog #313 — as well as My Comment at the bottom of the page in the June 17, 2024 post in Dr. Smith's ECG Blog ). ECG Blog #233 — Reviews a case of Acute PE ( with discussion of ECG criteria for this diagnosis ). ECG Blog #119 — Reviews a case of Acute PE ( and ECG criteria for this diagnosis ).
I fully acknowledge that prior to 2010, when I started my ECG Blog and began my heavy involvement in ECG internet consultation — I had no direct experience with Epsilon waves. R elated E CG B log P osts to Today’s Case : ECG Blog #205 — Reviews my S ystematic A pproach to 12-lead ECG Interpretation. ECG Blog #35 — Review of RVOT VT.
For more on fusion beats — See ECG Blog #128 and Blog #129 ). See ECG Blog #133 ). R elated E CG B log P osts to Today’s Case : ECG Blog #185 — Reviews my System for Rhythm Interpretation , using th e P s, Q s & 3 R Approach. ECG Blog #198 — Can VT be Irregular? ECG Blog #393 — Case of multiple Fusion beats.
NOTE: For more on ECG recognition of RVH and/or pulmonary hypertension ( re the qR pattern in lead V1 ) — See ECG Blog #234 and Blog #248. This could have been an optimal time to try a Lewis Lead — which sometimes reveals atrial activity not evident with standard lead placement ( See ECG Blog #223 ).
MY Approach to the Rhythm in Figure-1: As per ECG Blog #185 — I favor the P s, Q s, 3 R Approach for interpretation of the cardiac rhythm — beginning with whichever of these 5 KEY Parameters is easiest to assess for the tracing in front of me: At least in the single lead II rhythm strip seen in Figure-1 — The Q RS complex appears to be narrow.
Easy LINKS — tinyurl.com/KG-ECG-Podcasts — [link] — Other ECG Audio PEARLS I previously made for my ECG Blog can be found in the right column of each page on this blog just below this icon — under, "ECG Audio PEARLS". I recently recorded a series of 4 podcasts regarding KEY concepts in ECG interpretation.
MY Impression of ECG #1: The above 5 Observations confer ECG features that characterize "the Footprints of Wenckebach!" — which is why within seconds of seeing today's ECG, I was virtually certain there was some form of 2nd-degree AV Wenckebach ( See ECG Blog #164 — ECG Blog #55 — ECG Blog #347 — and ECG Blog #154 ).
I have previously reviewed a number of cases of "Shark Fin" morphology ( Se e ECG Blog #364 — Blog #410 — Blog #265 — among others ). R elated E CG B log P osts to Today’s Case : ECG Blog #185 — My P s, Q s, 3 R System for Rhythm Interpretation.
As opposed to polymorphic VT that by definition is irregularly irregular — monomorphic VT is usually a fairly ( if not completely ) regular rhythm ( See ECG Blog #231 for the various forms of VT ). Regarding Q - R - S - T Changes: There is a Q wave in lead III. R wave progression is not normal.
As reviewed in ECG Blog #231 — QRS morphology in VT may manifest a number of different forms. For more on the diagnostic significance of identifying AV dissociation in wide tachycardia — See ECG Blog #133 and ECG Blog #151. ECG Blog #205 — Reviews my Systematic Approach to 12-lead ECG Interpretation.
To EMPHASIZE: One of my goals in developing this ECG Blog — is to help clinicians to optimize their time efficiency. By the P s, Q s, 3 R Approach ( See ECG Blog #185 ) — the rhythm in the long-lead II of Figure-1 is not R egular. That said, as emphasized in ECG Blog #312 — SA block is rare!
We organize all of the trending information in your field so you don't have to. Join thousands of users and stay up to date on the latest articles your peers are reading.
You know about us, now we want to get to know you!
Let's personalize your content
Let's get even more personalized
We recognize your account from another site in our network, please click 'Send Email' below to continue with verifying your account and setting a password.


Let's personalize your content