This site uses cookies to improve your experience. To help us insure we adhere to various privacy regulations, please select your country/region of residence. If you do not select a country, we will assume you are from the United States. Select your Cookie Settings or view our Privacy Policy and Terms of Use.
Cookie Settings
Cookies and similar technologies are used on this website for proper function of the website, for tracking performance analytics and for marketing purposes. We and some of our third-party providers may use cookie data for various purposes. Please review the cookie settings below and choose your preference.
Used for the proper function of the website
Used for monitoring website traffic and interactions
Cookie Settings
Cookies and similar technologies are used on this website for proper function of the website, for tracking performance analytics and for marketing purposes. We and some of our third-party providers may use cookie data for various purposes. Please review the cookie settings below and choose your preference.
Strictly Necessary: Used for the proper function of the website
Performance/Analytics: Used for monitoring website traffic and interactions
A transthoracic echocardiogram (TTE) revealed a mobile mass on the right coronary cusp of the aorticvalve ( figure 1 , ). cm) at the right coronary cusp of the aorticvalve on the long-axis and short-axis parasternal view. Figure 1 A mobile mass (1.88 Question What is the most likely diagnosis?
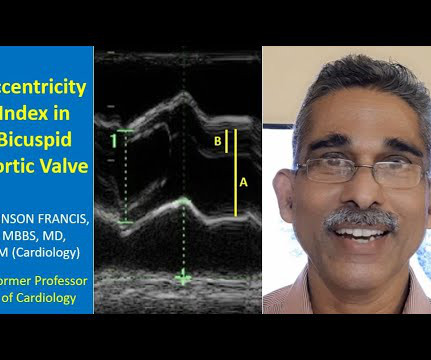
Transcript of the video: Closure line of aorticvalve on M-Mode echocardiogram, is seen as central line, while in bicuspid aorticvalve, it is an eccentric closure, nearer to one of the walls of the aorta. That is an important feature of bicuspid aorticvalve on M-Mode echocardiogram.
Cedars-Sinai and Smidt Heart Institute investigators developed a novel foundation model that integrates computer vision interpretation of echocardiogram images with natural language processing to augment cardiologists’ interpretation of echocardiograms. Image by Getty.
Echocardiograms using the robotic arm resulted in the same diagnosis as conventional in-person echocardiography in 98% of cases (papillary muscle level obstruction was missed in one case). tim.hodson Thu, 08/29/2024 - 11:39 Aug. 28, 2024 — New research presented at this year’s ESC Congress 2024 in London, UK (Aug. 30 – Sept.
Transcript of the video: This is a still image from a colour Doppler echocardiogram, obtained from the apical five chamber view. Here, this is the forward flow through the mitral valve in diastole in red. This is reverse flow from the aorticvalve, that is aortic regurgitation jet. That also occurs in diastole.
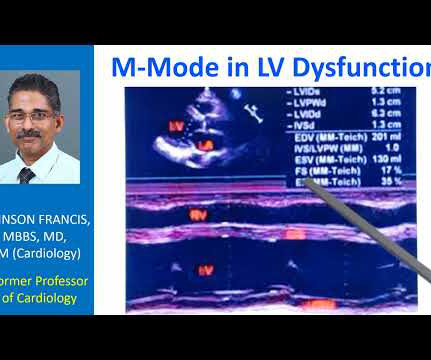
Transcript of the video: This is a still image of M-Mode Echocardiogram. Right ventricular outflow tract, left ventricle, left atrium, aorta, aorticvalve, mitral valve. M-Mode is Time-Motion Mode. The horizontal axis is time. Vertical axis is distance from the transducer. This is the parasternal long axis view.
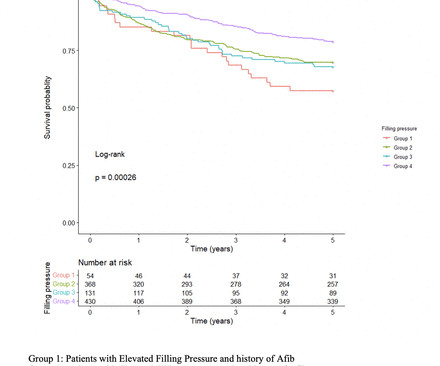
Background Increase in left ventricular filling pressure (FP) and diastolic dysfunction are established consequences of progressive aortic stenosis (AS). However, the impact of elevated FP as detected by pretranscatheter aorticvalve replacement (TAVR) echocardiogram on long-term outcomes after TAVR remains unclear.
The patient was managed medically and was referred to us in view of worsening symptoms with severe left ventricular dysfunction and moderate aortic regurgitation. Echocardiogram, CT aortogram and late gadolinium imaging of the aorta have been shown in figure 1. The coronary angiogram was normal.
You can see the reverse flow into the left ventricle from the aorta, with the aorticvalve in closed position. Beacuse, as the aorticvalve is closed, and the regurgitant jet is coming in, and left ventricular diastolic pressures are lower than the aortic pressures. Here it is the AR jet.
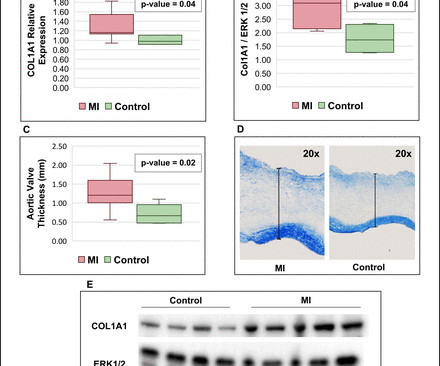
It is unknown whether MI also induces pathological remodelling of the aorticvalve and alters aortic stenosis (AS) progression. We thus compared AS progression after an acute MI and in patients with/without history of MI, and assessed post-MI pathobiological changes within the aorticvalve leaflets in a sheep model.
Background:Peak aorticvalve Doppler velocity, mean aorticvalve gradient, and Doppler estimated aorticvalve area are key measures recommended for assessing aortic stenosis severity. Failure to accurately diagnose severe aortic stenosis is critical.
Background: Symptomatic severe aortic stenosis (AS) remains undertreated with high resultant mortality despite increased growth and availability of aorticvalve replacement (AVR) since the advent of transcatheter therapies. The patient cohort had mean age of 7711 years, was 47% female, and had mean aorticvalve area 0.80.1
Data from the studies demonstrated that AISAP CARDIO enables non-cardiologist physicians to interpret point-of-care echocardiograms just as well as expert cardiologists of the MGB echocardiography lab. James Hillis, MBBS, DPhil, director of Clinical Operations at Mass General Brigham AI.
Transcript of the video: This is a still image from a colour Doppler echocardiogram, obtained from the apical five chamber view. Here, this is the forward flow through the mitral valve in diastole in red. This is reverse flow from the aorticvalve, that is aortic regurgitation jet. That also occurs in diastole.
Residents also received instruction in mitral valve and aorticvalve surgery, giving and receiving feedback in the operating room, and the importance of performing ablation. The best parts of the Boot Camp were learning the basics of CT surgery, the vast topics covered (transthoracic echocardiogram, lobectomy, etc.)
Patent Foramen Ovale 4. Severe calcific Aortic (valve) Stenosis 5. Mechanical prosthetic valve Severe carotid artery stenosis is also implicated in embolic stroke. This is further complicated if no reliable source of history can be found, such as a family member, or paperwork containing pertinent medical history.
Transthoracic echocardiogram revealed right to left shunting consistent with a patent foramen ovale (PFO). Further workup with TEE confirmed the presence of a PFO but also detected a mobile echogenic mass on the aorticvalve leaflet, indicative of papillary fibroelastoma (PFE).
Similarly, for echocardiogram, what we would do usually is, first we do a clinical history evaluation, then physical examination, and after that only we proceed with echocardiography in our routine work. You can see the two dimensional sector imaging from an echocardiogram and I have marked out the aorta.
Echocardiogram in parasternal long axis view shows dilated left ventricle, left atrium, aorta and a small portion of the right ventricle, which is usually the outflow region. Mitral valve leaflets seen in open position between the left ventricle and left atrium are thickened. Aorticvalve is seen as grossly thickened and calcified.
The image shown here is an animated 2 dimensional echocardiogram. This one is an older mode known as time-motion mode or M-Mode echocardiogram. An annotated video of normal colour Doppler echocardiogram illustrating various views and an M-Mode tracing is shown here. Exact position and angulation will vary between individuals.
The diagnostic coronary angiogram identified only minimal coronary artery disease, but there was a severely calcified, ‘immobile’ aorticvalve. Aortic angiogram did not reveal aortic dissection. If you see this, you should Doppler the valve. Aorticvalve surgery as an emergency procedure.
The next morning the patient went for his routine echocardiogram, where the operator noticed a dilated aortic root at 5.47 cm with severe aortic insufficiency. The team was notified and they ordered a stat aortagram which showed type A aortic dissection from the aorticvalve to the iliacs.
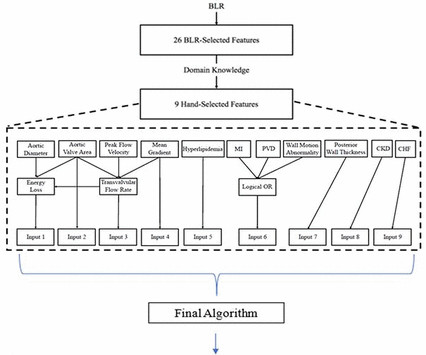
Methods In 1130 patients with moderate or severe AS, we used bootstrap lasso regression (BLR), an ML method, to identify echocardiographic and clinical features important for predicting the combined outcome of all-cause mortality or aorticvalve replacement (AVR) within 5 years after the initial echocardiogram.
Objective We developed an artificial intelligence decision support algorithm (AI-DSA) that uses routine echocardiographic measurements to identify severe aortic stenosis (AS) phenotypes associated with high mortality. million echocardiograms were randomly spilt into two groups. Methods 631 824 individuals with 1.08
An echocardiogram revealed the heart condition that would define much of his early life: severe congenital heart defects. His aorticvalve had begun thickening, requiring intervention to prevent further complications. That test revealed an irregular heart rate, prompting a more in-depth evaluation.
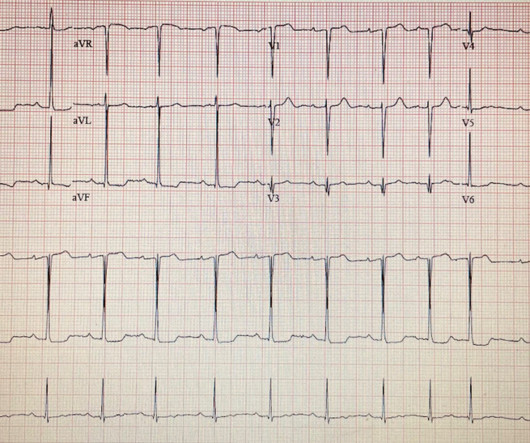
More troponin values were measured at the cardiac center: 2327- 267 ng/L 0821- 355 ng/L 1108- 305 ng/L An echocardiogram on day three of the patients admission showed an ejection fraction of 46% with abnormal basal inferior and basal lateral segments, and severe aortic stenosis.
We organize all of the trending information in your field so you don't have to. Join thousands of users and stay up to date on the latest articles your peers are reading.
You know about us, now we want to get to know you!
Let's personalize your content
Let's get even more personalized
We recognize your account from another site in our network, please click 'Send Email' below to continue with verifying your account and setting a password.


Let's personalize your content